Connect the sources
Open up machines and meters over suitable protocols.
Suggestions appear from three characters.
No match. Try another term or choose a topic below.
Validate the controller against a model
The topic area at a glance
Customers we work for
Joint projects and their results
Working at IQstruct Engineering
ISO 9001 and TISAX
Alliances, associations, marketplaces
Quality policy and certificate
 Ai
AiProduction and energy data becomes a basis for decisions only in context.
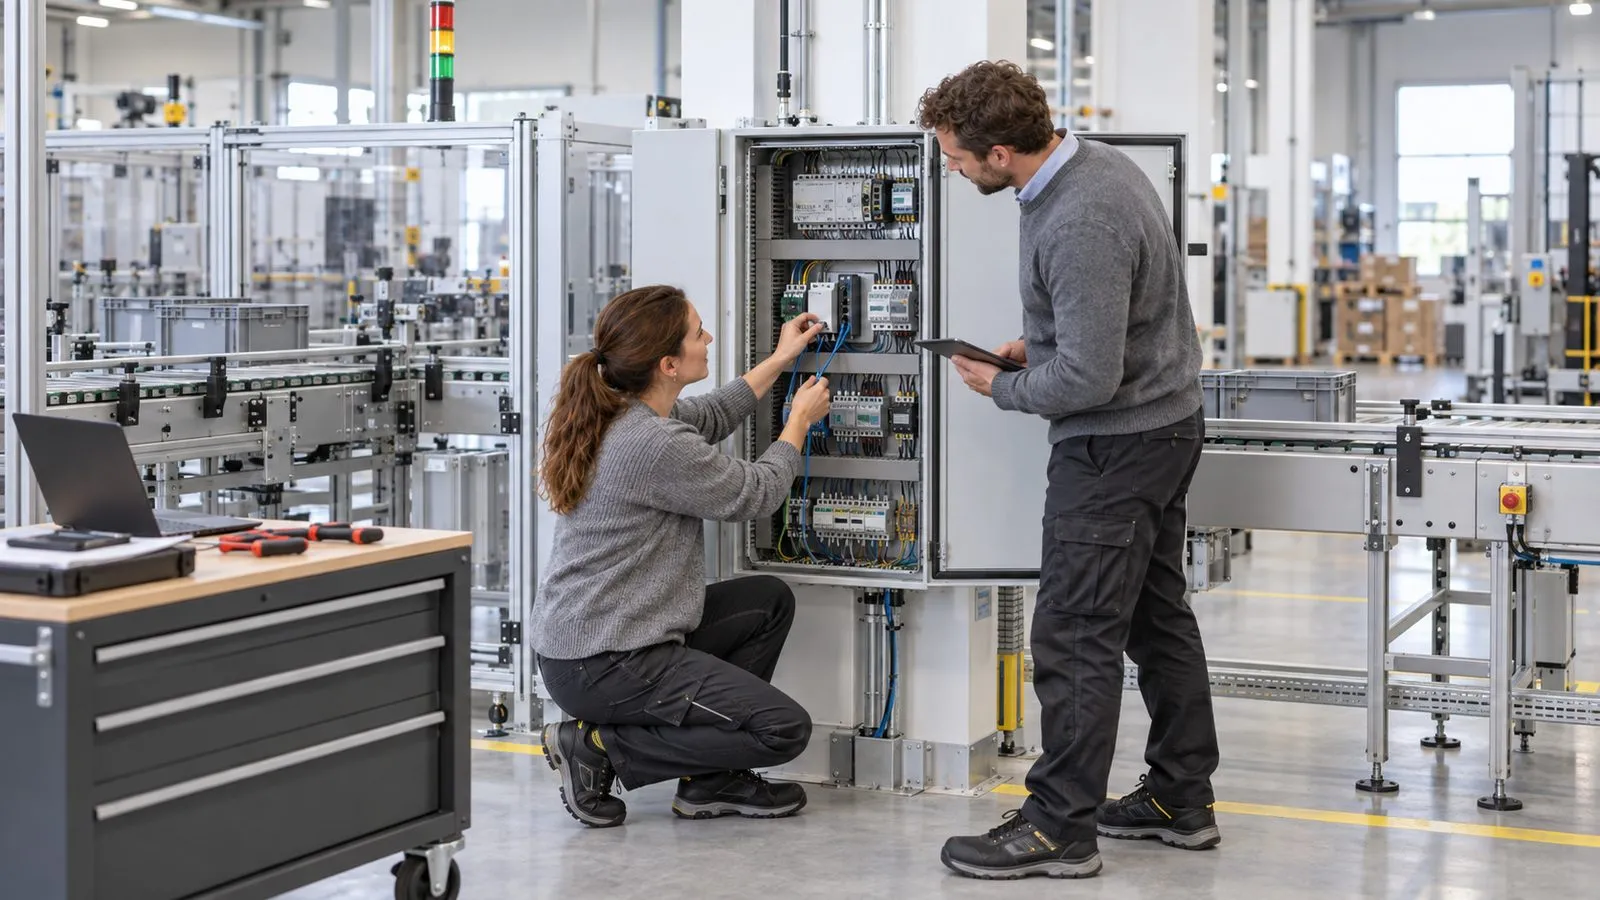
Machines deliver values, but a comparison by plant, shift or batch still calls for exports to be merged. Time stamps, units and interfaces do not match automatically. It therefore stays open whether a higher consumption comes from the product, from the operating state or from a fault. A usable data base needs a continuous and verifiable path from the data source to the analysis.
For that, acquisition, preparation and use have to be planned together. Otherwise the analysis stays dependent on manual rework and on the knowledge of individuals.
In a free first conversation we clarify which controllers are in the house, which question the data is meant to answer and where it has to arrive.
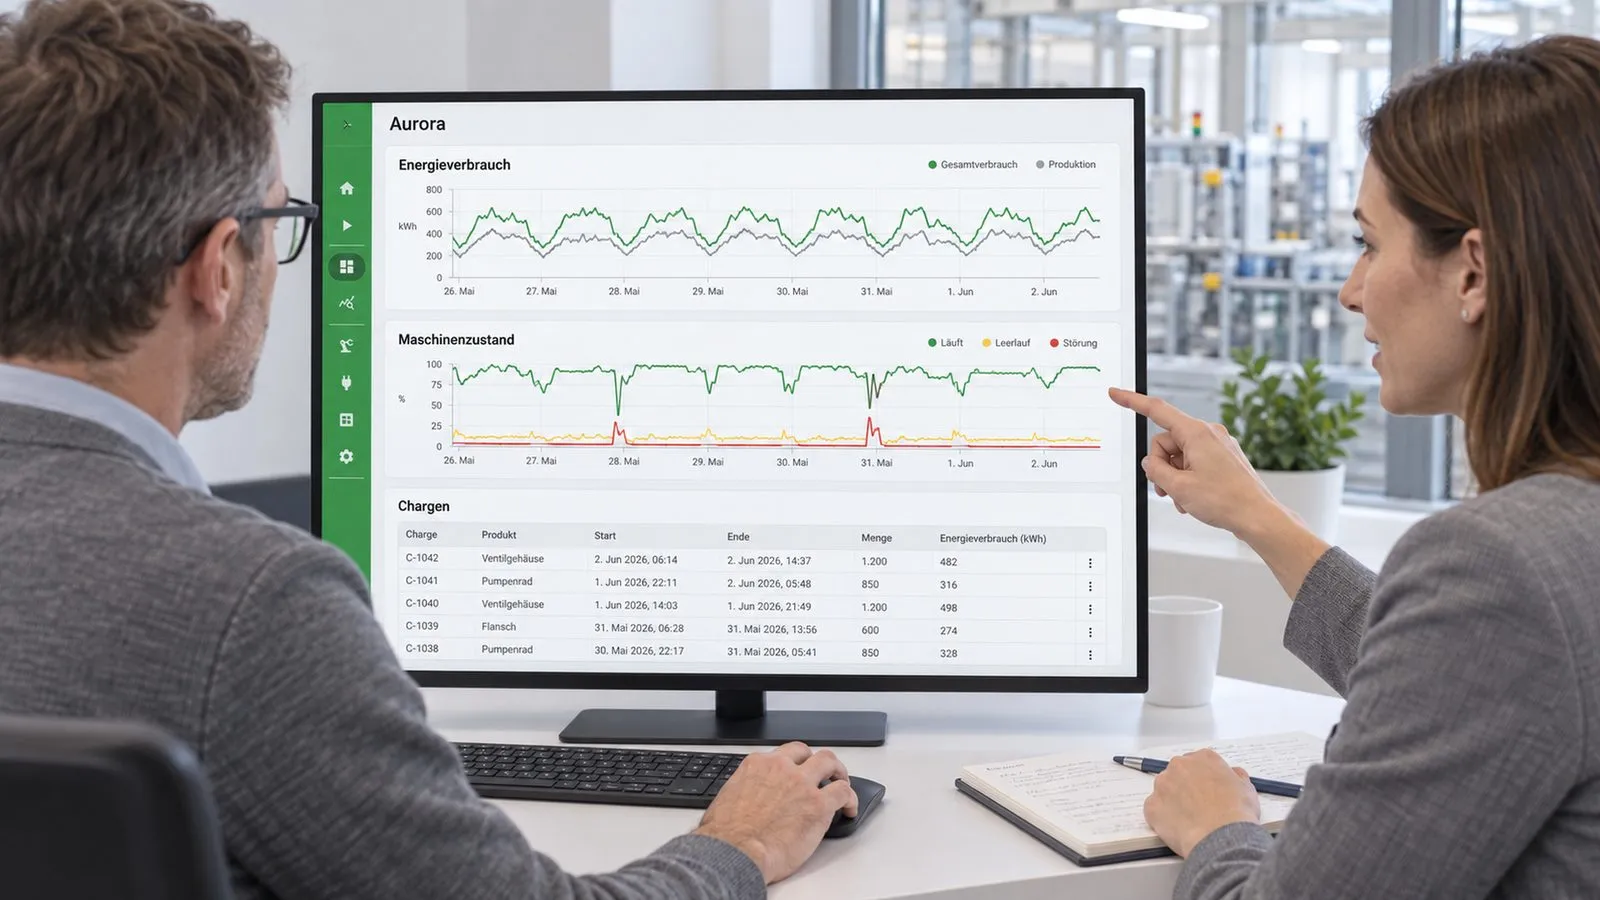
IQstruct Engineering opens up existing data sources, installs edge hardware and connects it via Aurora with analyses and target systems.
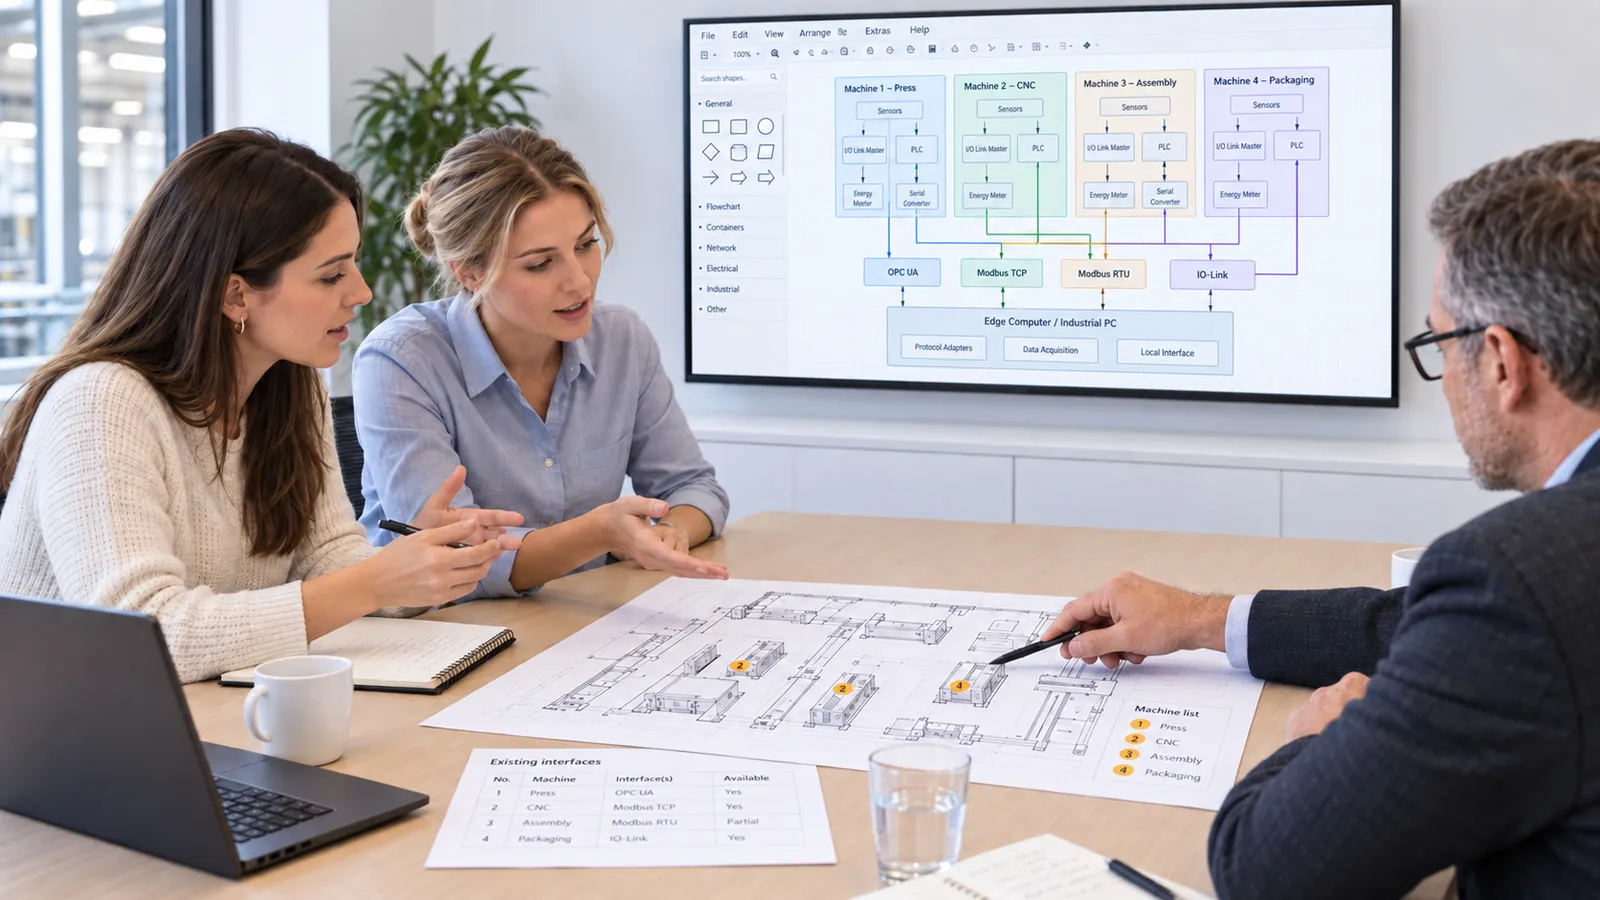
PLCs, energy and media meters and other devices with interfaces are connected via controller adapters, OPC UA, REST and MQTT. Time references link energy values with machines and production batches.
Asset administration shells add structured product and asset information. From the initial survey to operation, interfaces, data requirements and use are defined together; support, updates and monitoring can be part of it.
 Ai
AiIndustrial IoT
Production information leaves the individual controller and is available where it is needed.
Open up machines and meters over suitable protocols.
Link measured values with plants, shifts or batches.
Set up data flows to dashboards, databases and business systems.
 Ai
Ai1
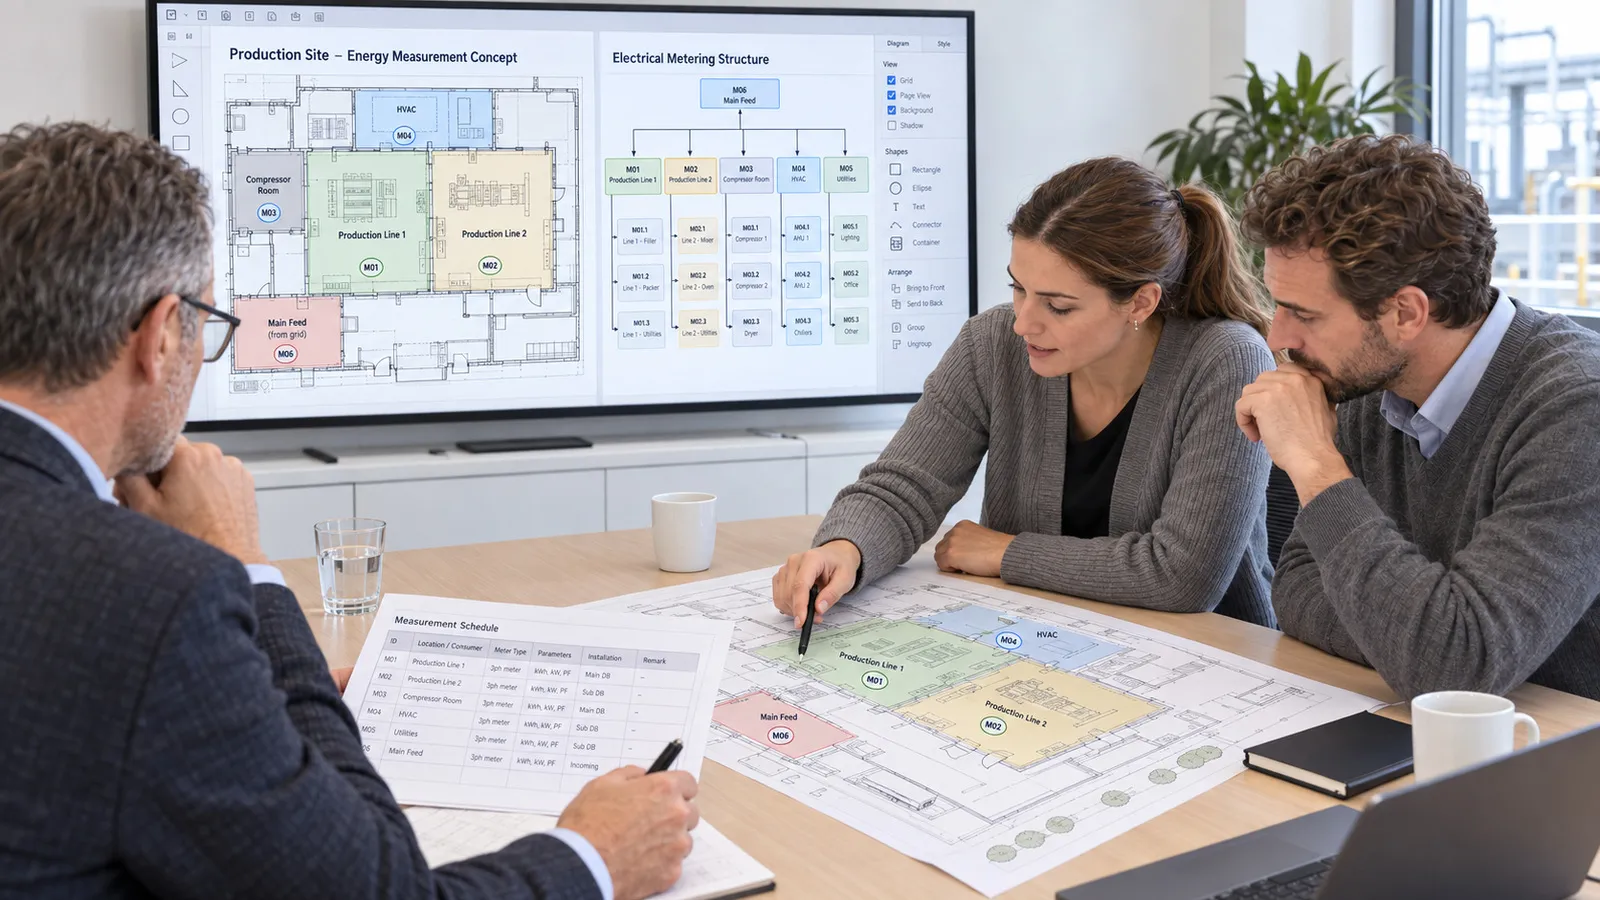
Create the metering concept
A metering point plan organises electrical consumers and production areas.
 Ai
Ai2
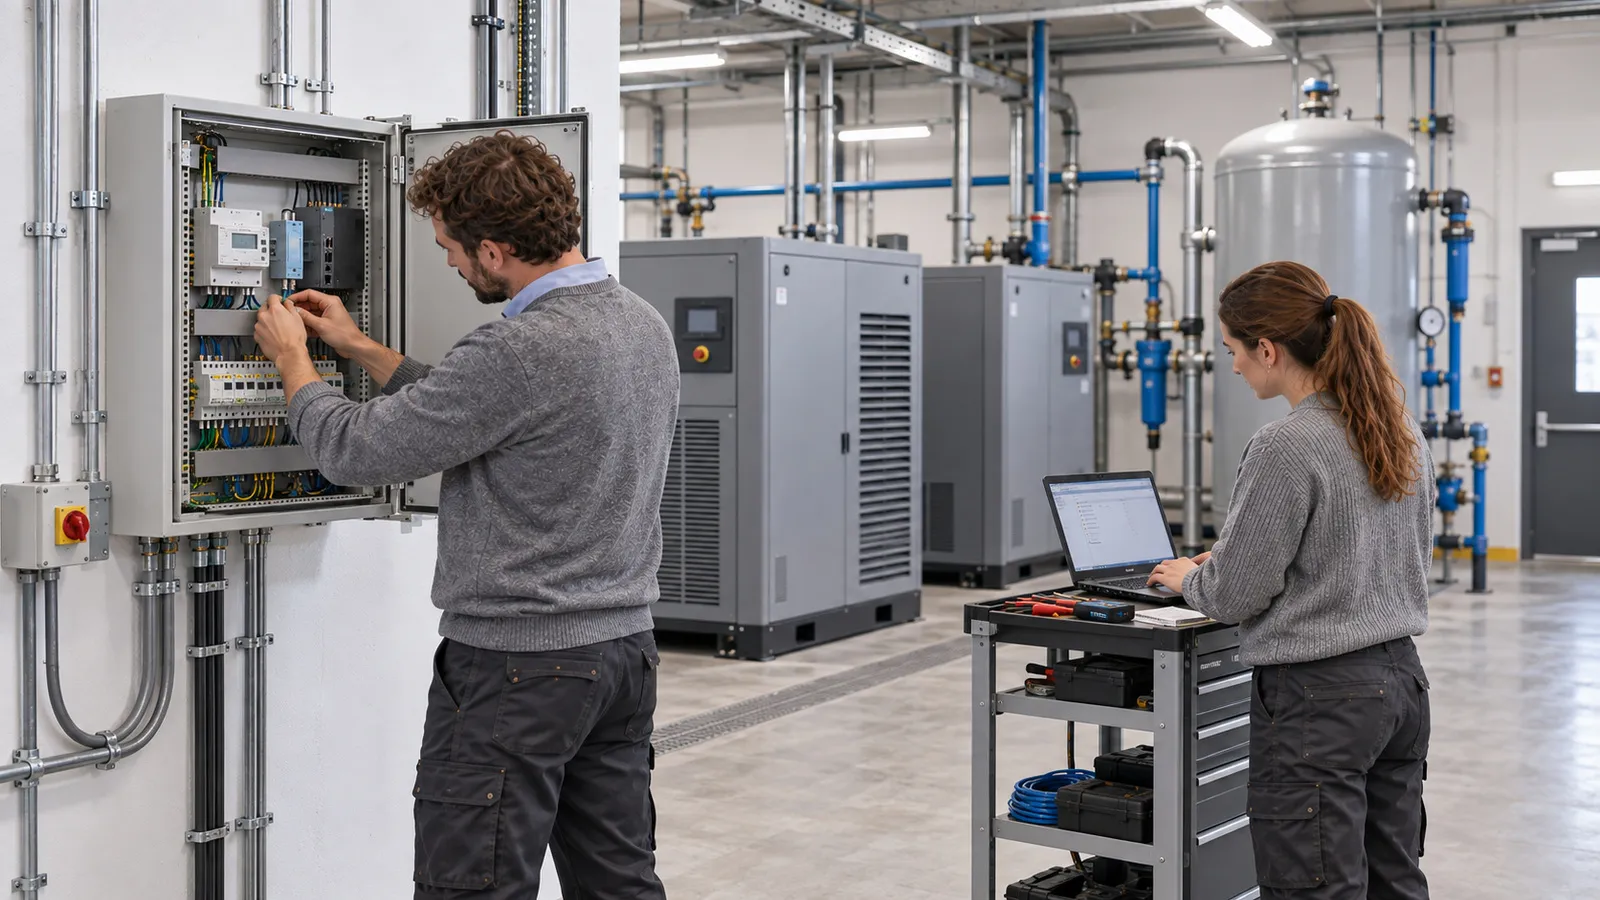
Connect the meters
Energy meters are connected to the edge PC, for example via RS-485 and suitable converters.
 Ai
Ai3
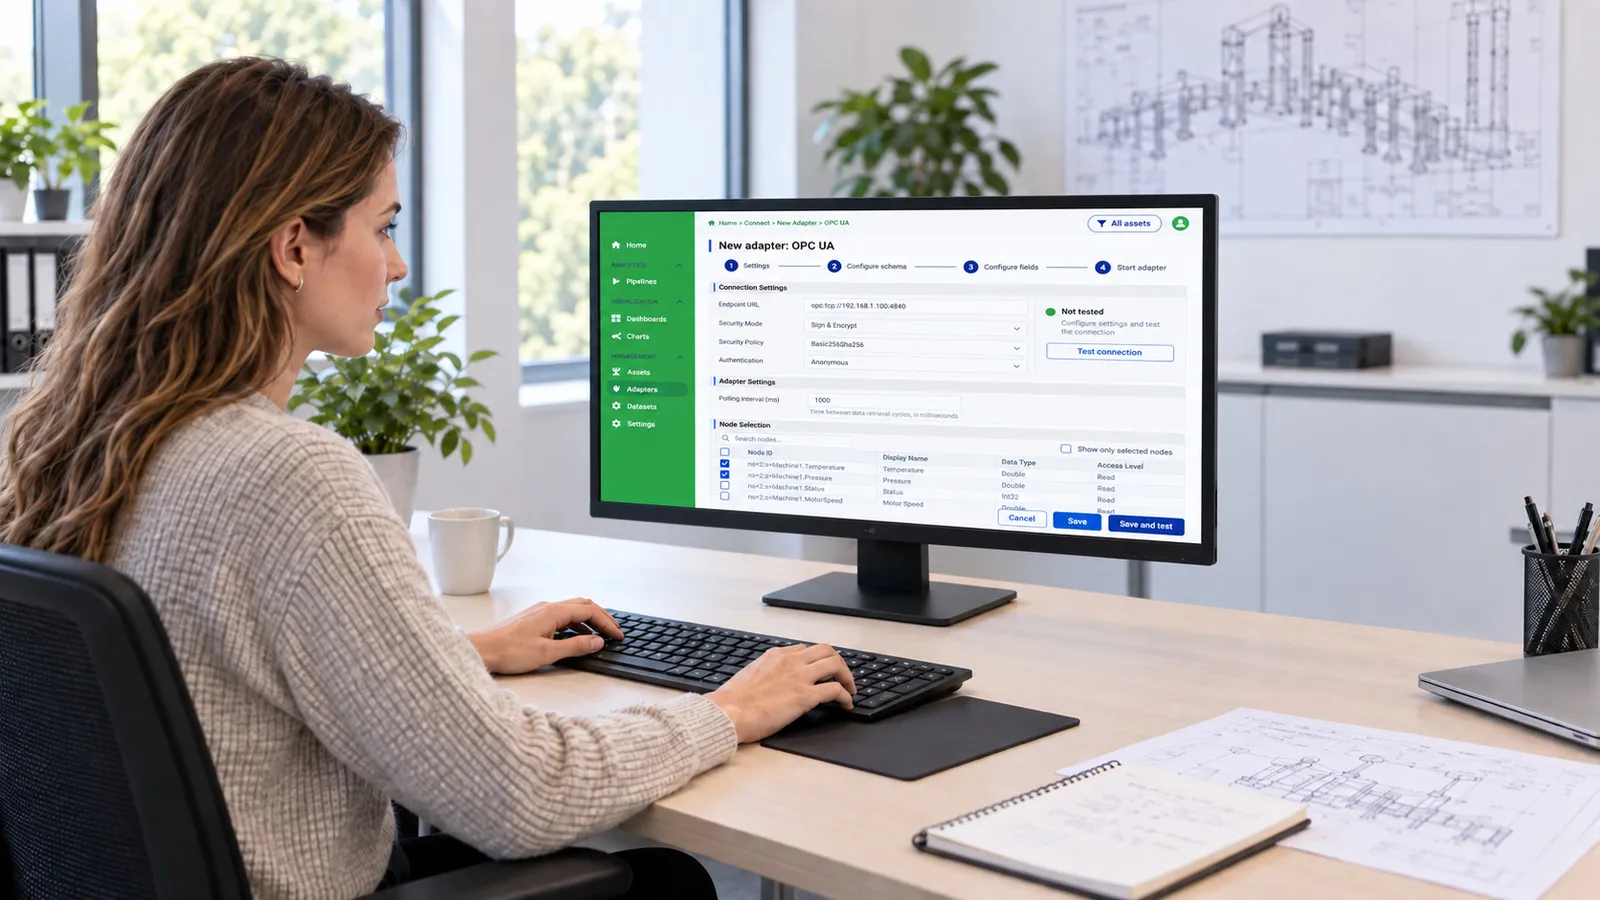
Configure Aurora
Adapters and data flow are set up in Aurora without programming.
 Ai
Ai4
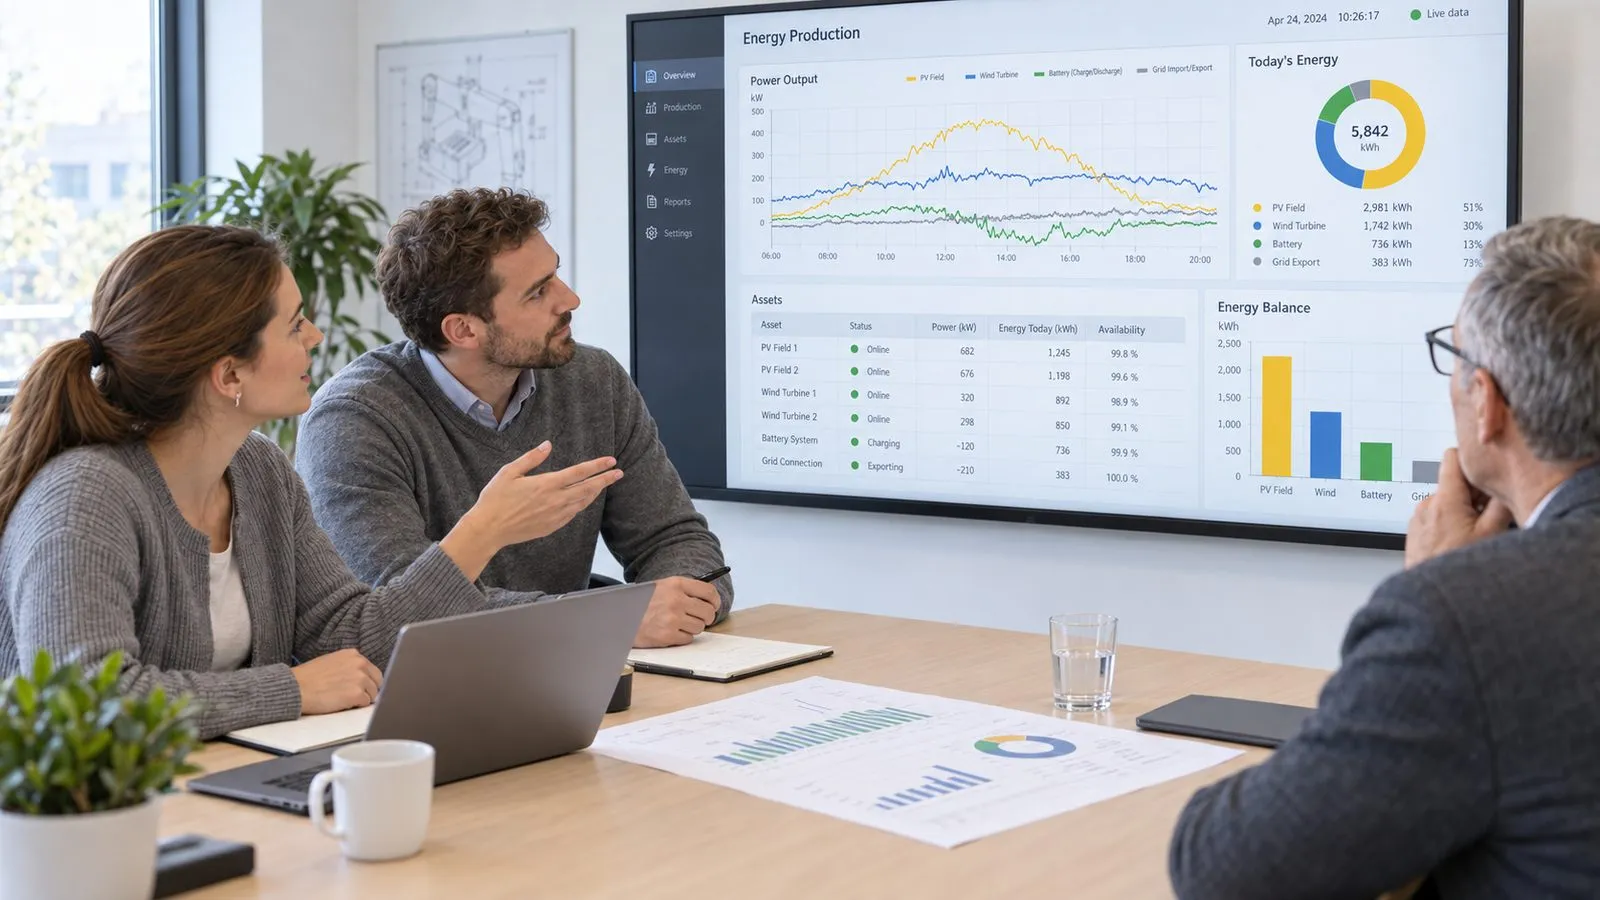
Check incoming energy data
Current values, timestamps and trends arrive in the dashboard and are checked.
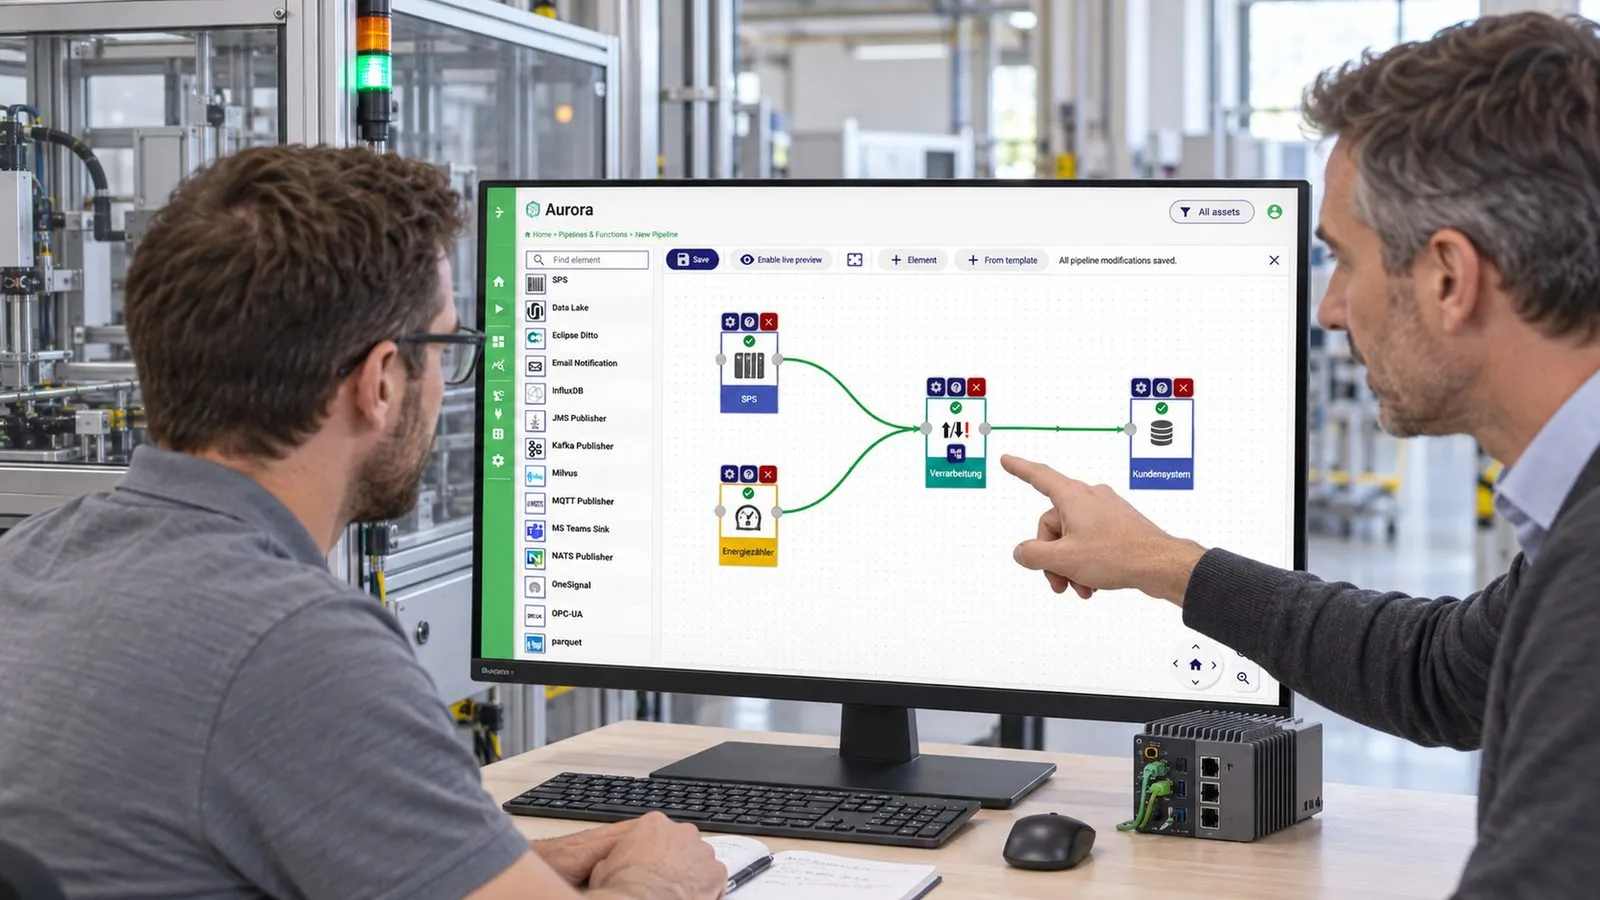
Aurora connects controllers, machines and measuring devices with the systems that use their data.
Adapters, time series and target systems are set up to match your data task. The joint configuration records which values are read, processed and passed on. Existing interfaces and places of operation determine the setup. IQstruct Engineering is a member of the Industrial Digital Twin Association (IDTA).






Project experience
Looking at energy and production together at a backing brick works.
IQstruct Engineering has delivered energy data monitoring for a backing brick works. The solution brings together values from transformer stations, the photovoltaic system and the combined heat and power plant with production data. Consumption can therefore be viewed in relation to the batches produced. Meter trends are available individually, aggregated and historically. The example shows why a single meter reading does not yet provide a reliable statement about the energy demand of a production step.
We are glad to answer your detailed questions in a personal conversation.
We quantify savings on the basis of reliable measured values from your plant, that is, after acquisition and analysis.
The connection is planned and agreed with the interfaces and permitted communication paths of your plants.
Locally in your environment, in a German data centre or in the cloud, depending on your requirements.
Every industry has its particularities. That calls for a reliable partner who knows the requirements and delivers suitable solutions.
First conversation
Describe your task. We agree a date and discuss the possible project scope.
 Ai
Ai1
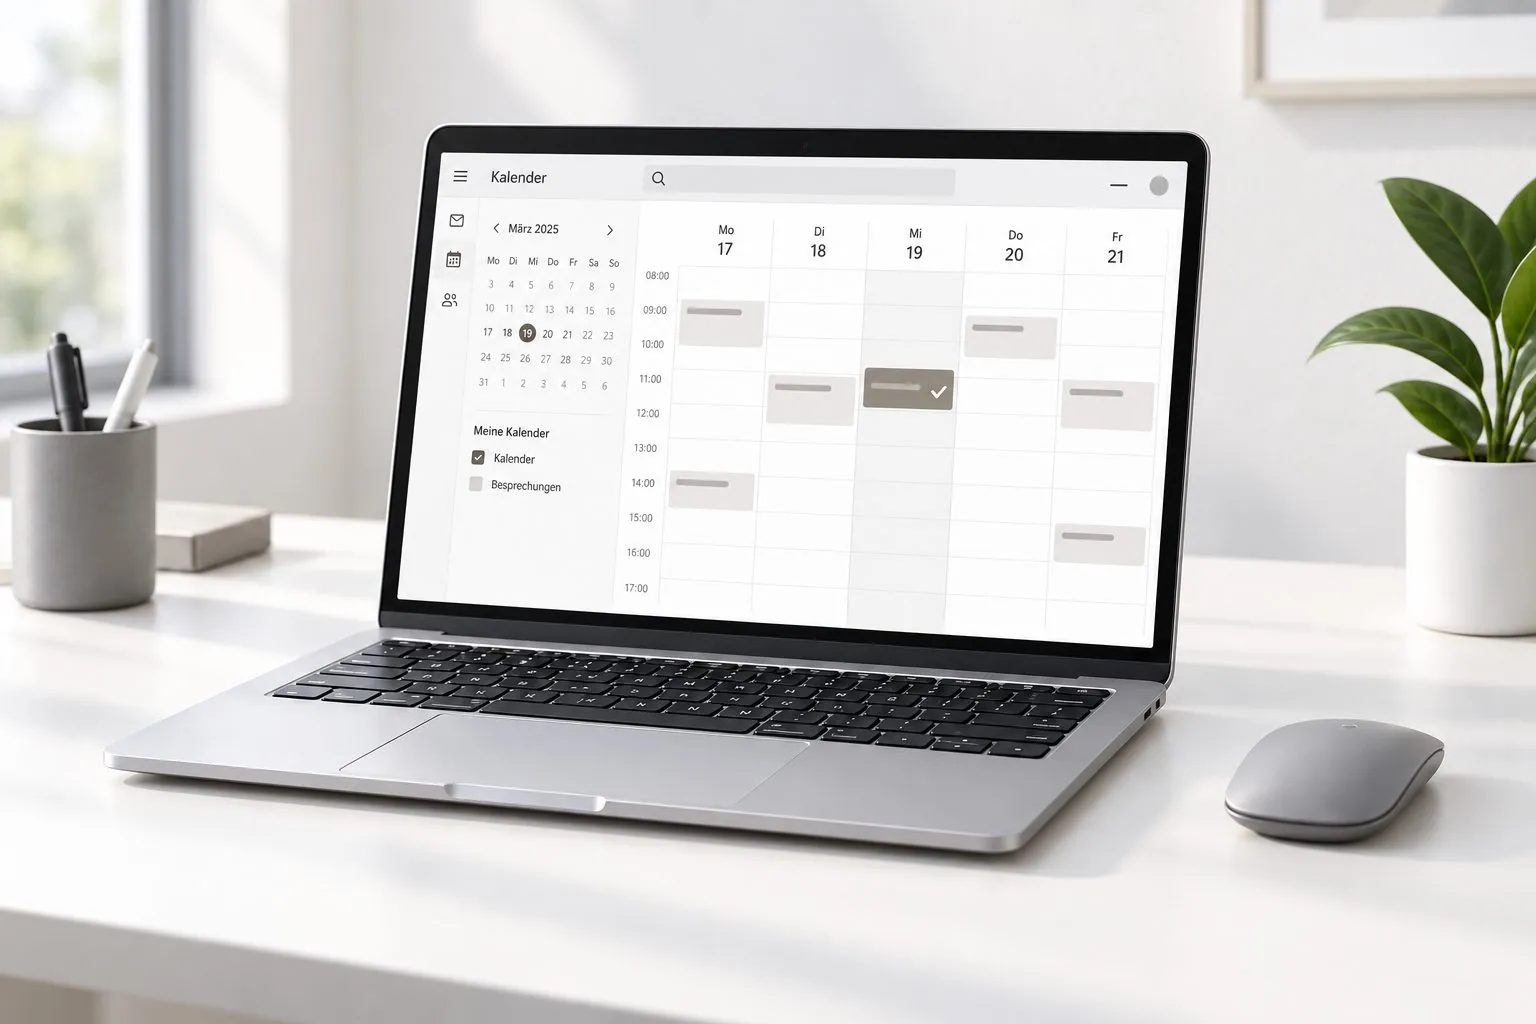
You request an appointment
 Ai
Ai2
We discuss your requirements
 Ai
Ai3
You receive a quotation for the agreed scope

Describe your task in the contact form. We come back with a proposed date.
Arrange a first conversationBooking calendar
The booking calendar appears here. It loads only after your consent, because your browser connects to Microsoft in the process.