Look at consumers separately
Main and secondary electrical consumers are recorded via suitable measuring points.
Suggestions appear from three characters.
No match. Try another term or choose a topic below.
Validate the controller against a model
The topic area at a glance
Customers we work for
Joint projects and their results
Working at IQstruct Engineering
ISO 9001 and TISAX
Alliances, associations, marketplaces
Quality policy and certificate
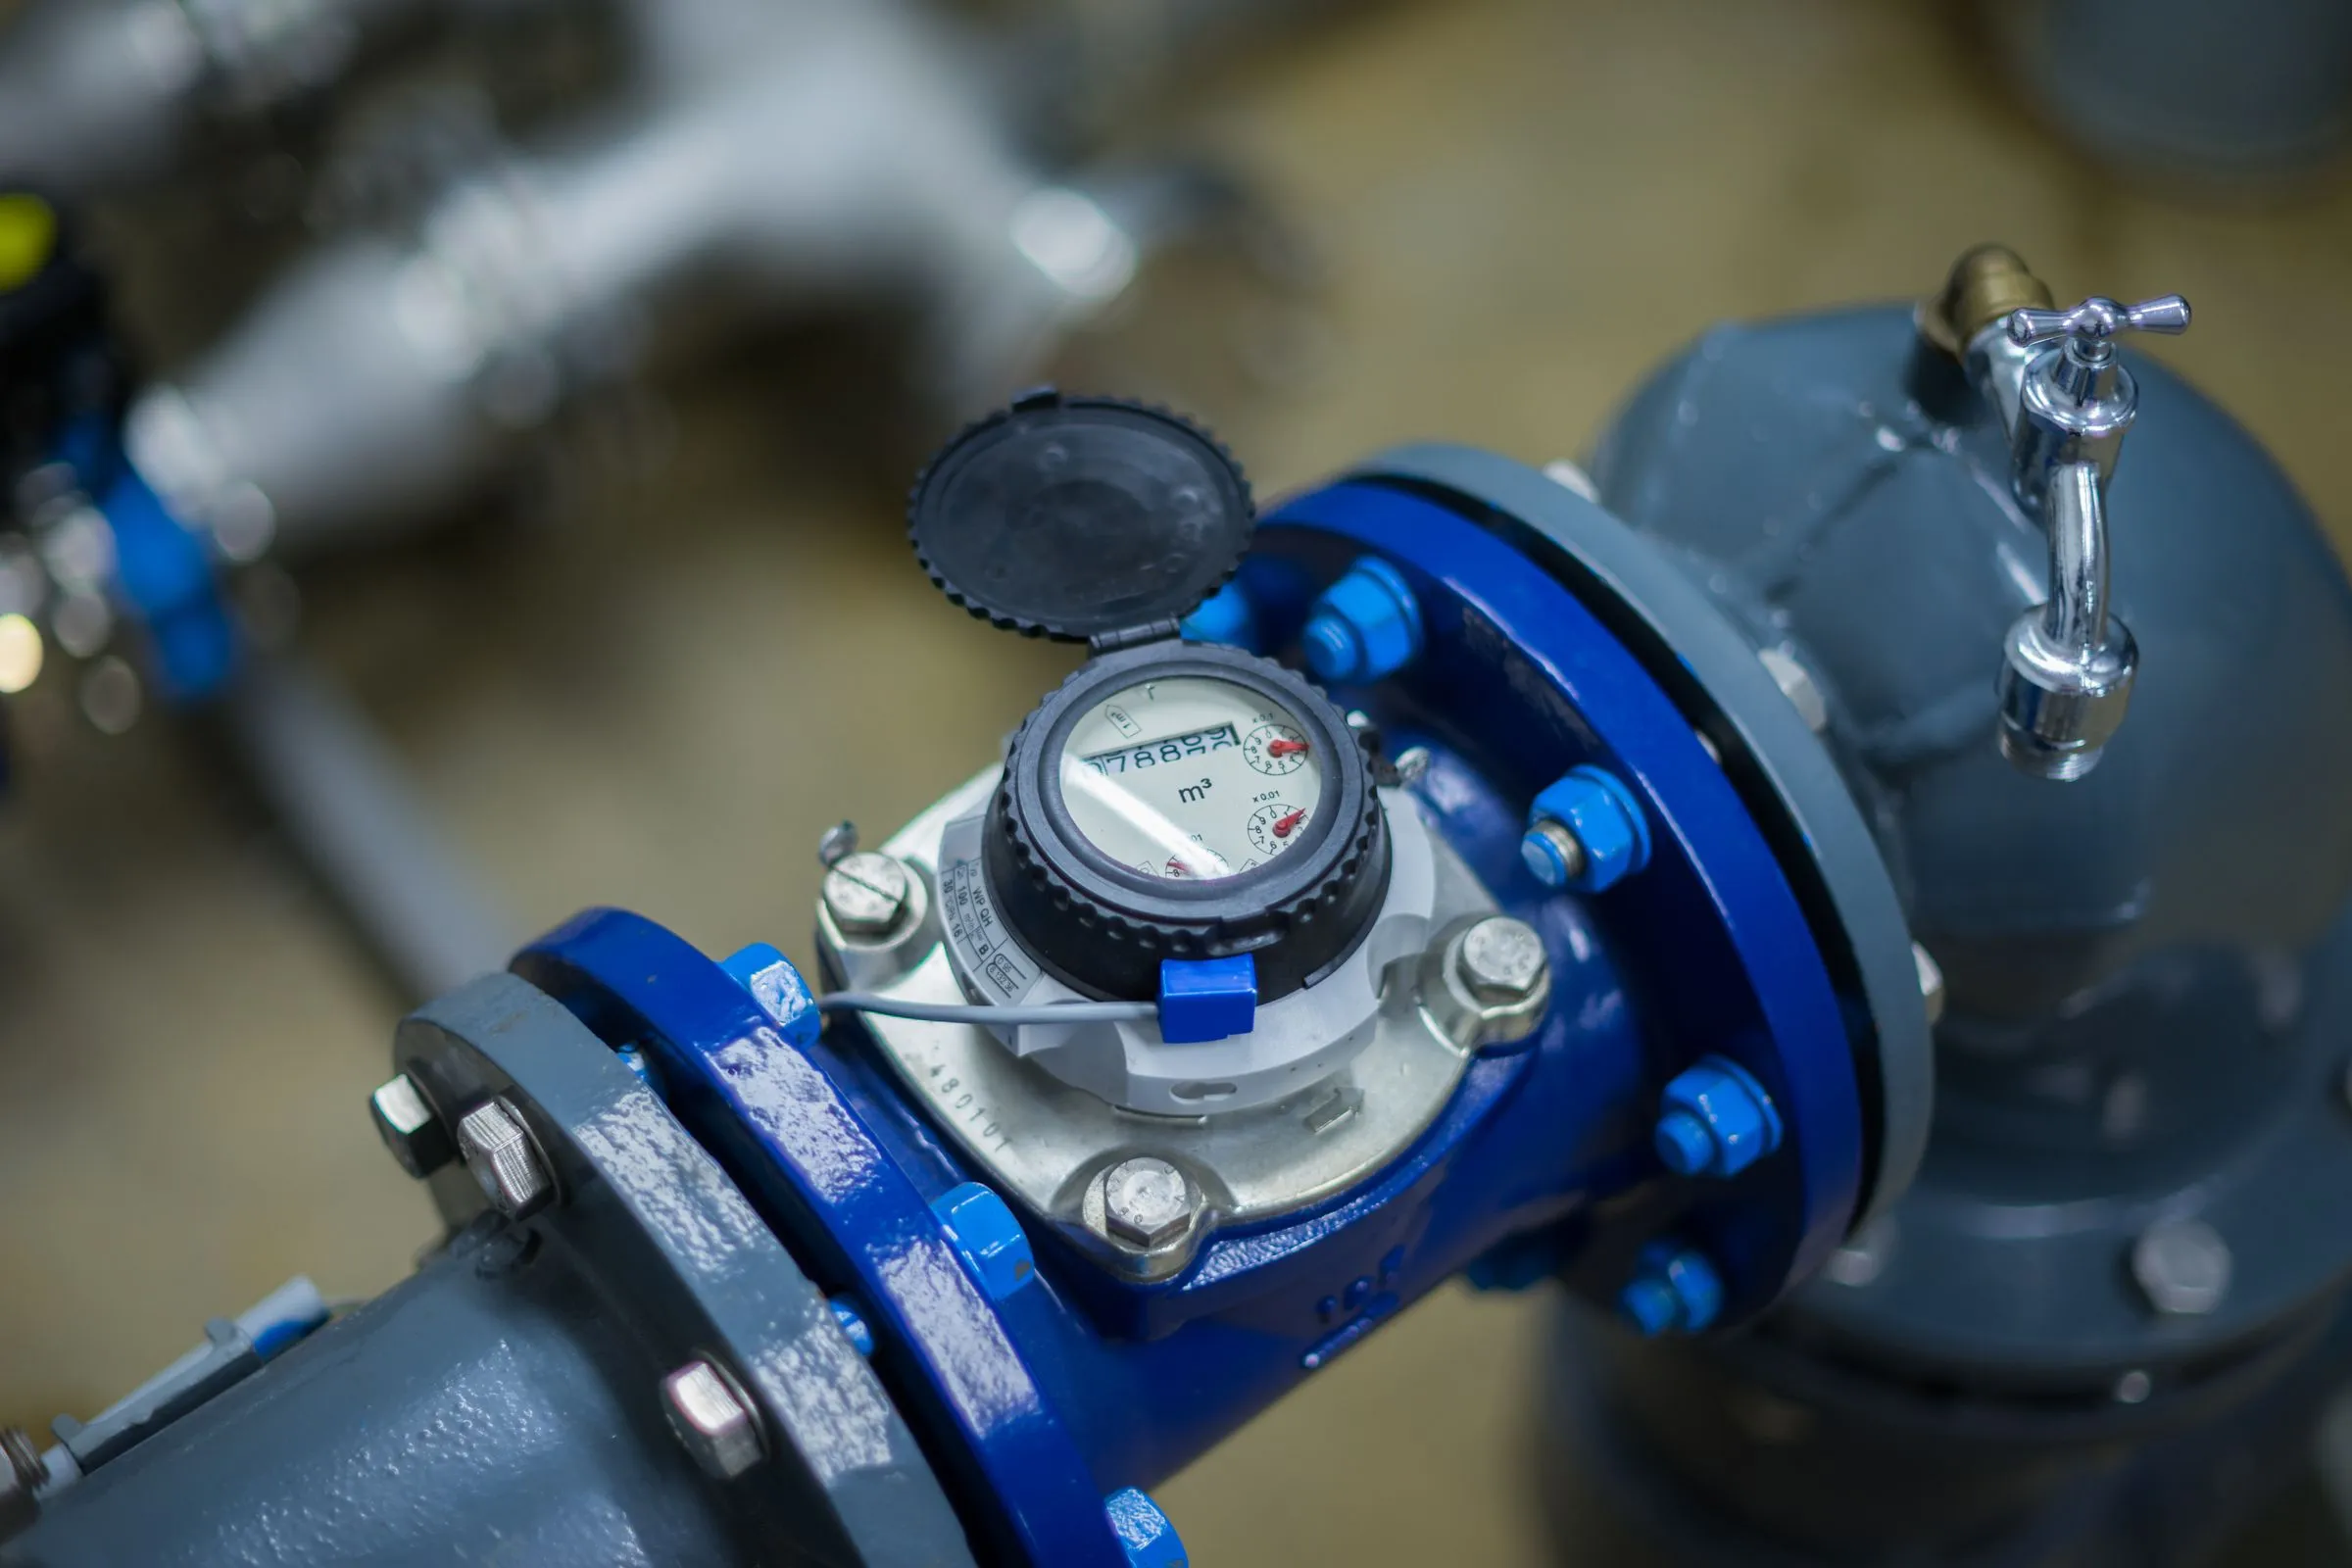
Measured values become meaningful when they can be assigned to plants, periods and quantities produced.
The main meter shows rising consumption, but not which line or batch is responsible for it. Individual measuring points deliver values at different intervals; downtime and productive running time are hard to separate. A reliable analysis therefore starts with a measurement plan and a consistent assignment. Only then can changes be compared and possible measures be justified on technical grounds.
In a free first conversation we clarify which meters exist, which plants carry the largest share and which reporting duty applies to you.
Main and secondary electrical consumers are recorded via suitable measuring points.
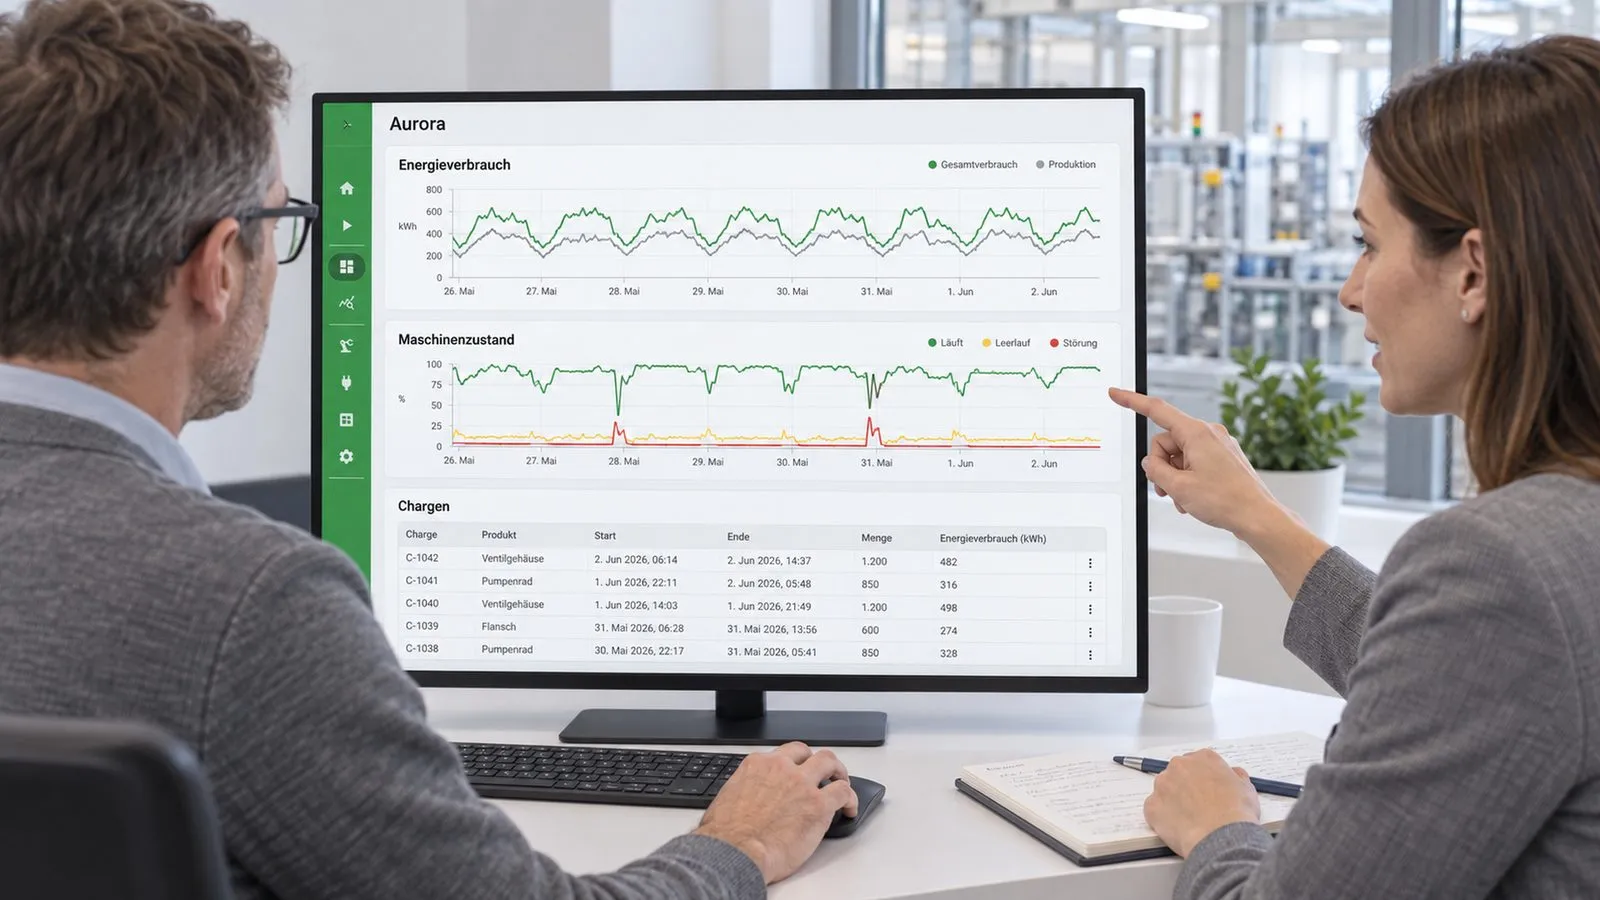
Time references connect continuous measured values with production batches.
Individual and aggregated meter views support the search for conspicuous changes.
IQstruct Engineering connects energy meters and large consumers such as compressed air generation.
The measured values are linked with production information and provided for the agreed analysis. The assignment can concern the site, line, machine, process, product or order and depends on the metering concept and the available data.
Compressed air generators and other secondary electrical consumers influence the energy use of a production. Measuring points and the production reference are therefore planned together. This creates a basis for historical comparisons; whether a change has a technical or an organisational cause is then assessed in the context of the process.
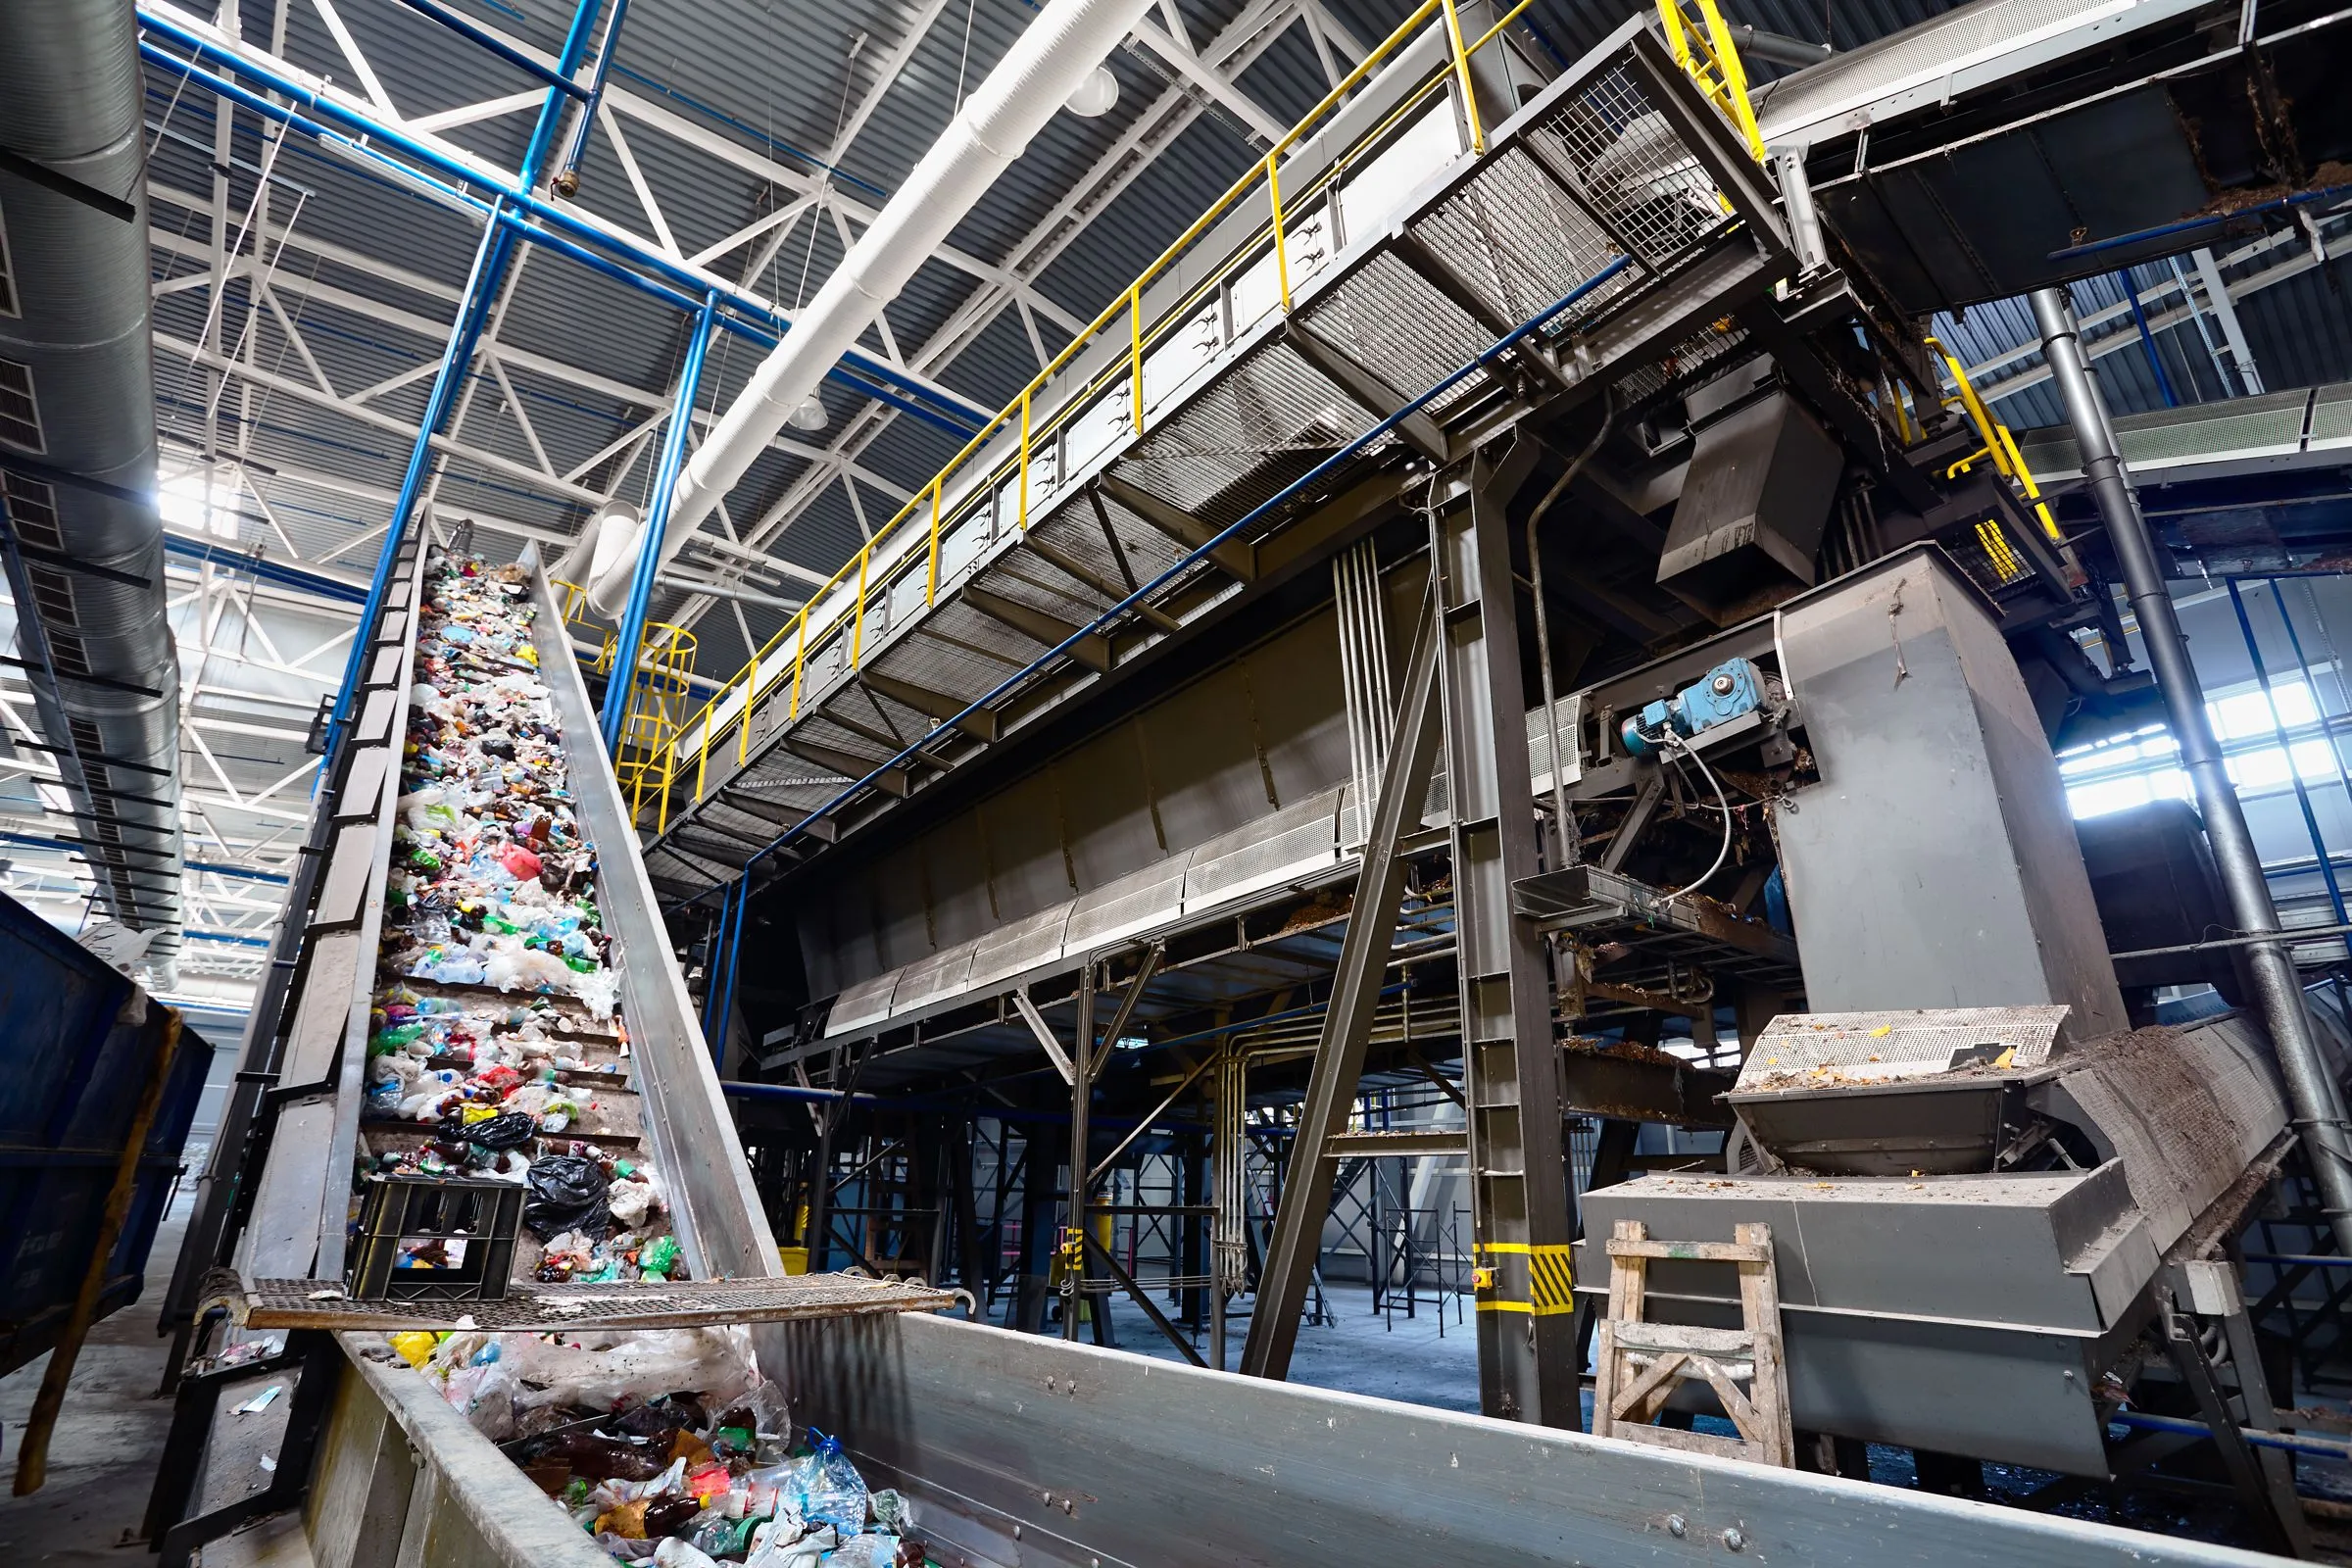
Batch reference
Time references connect continuous measured values with the quantity produced.
 Ai
Ai1
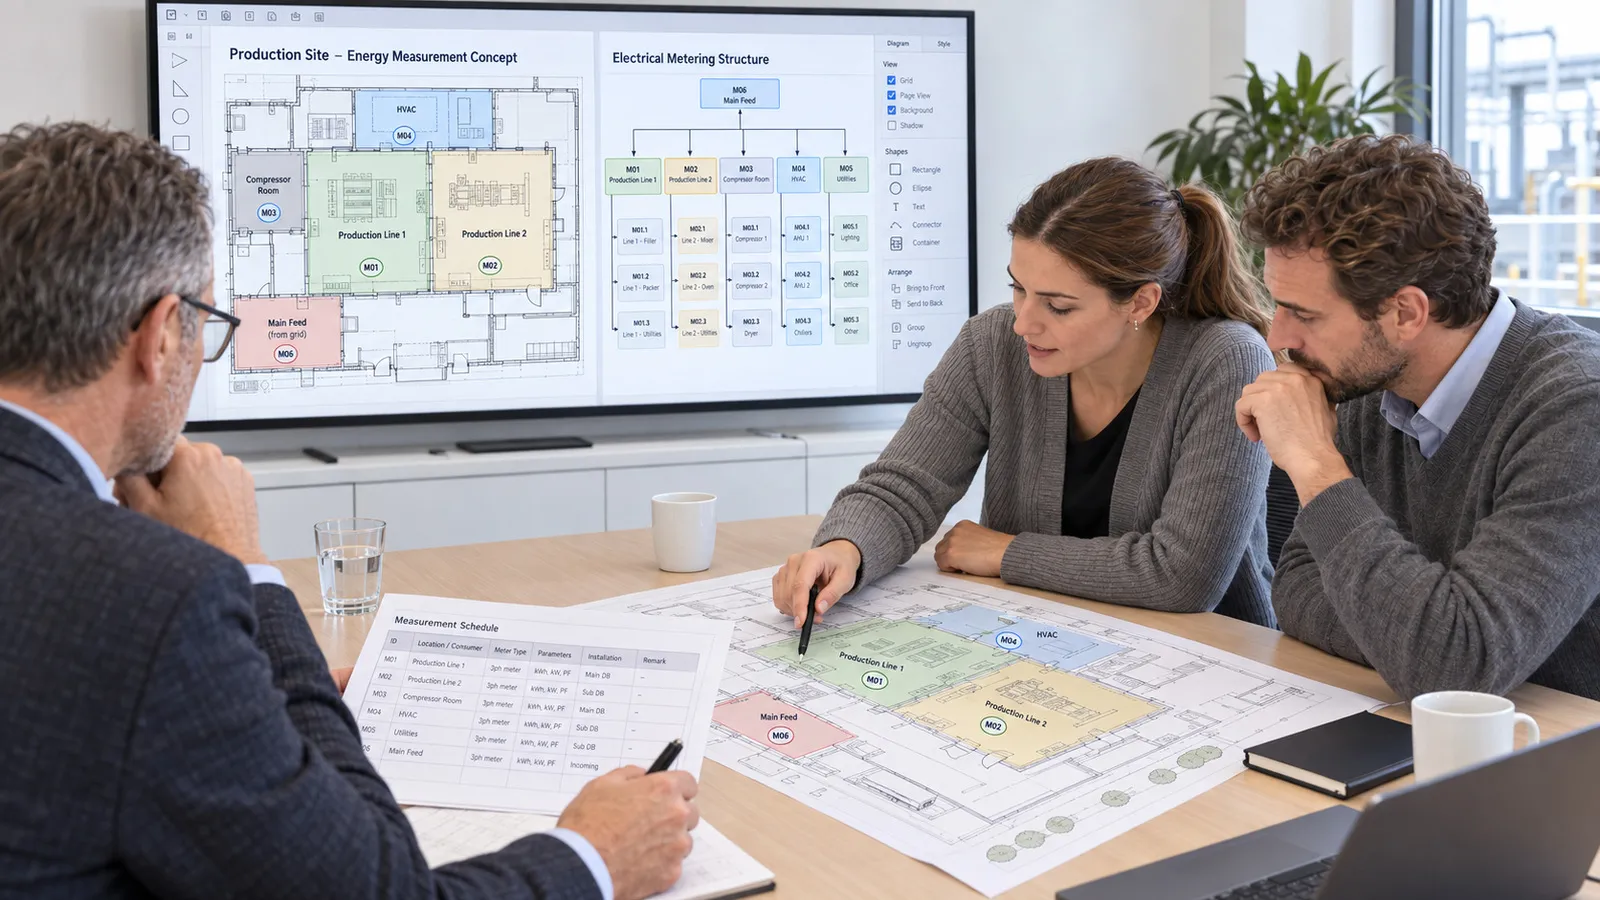
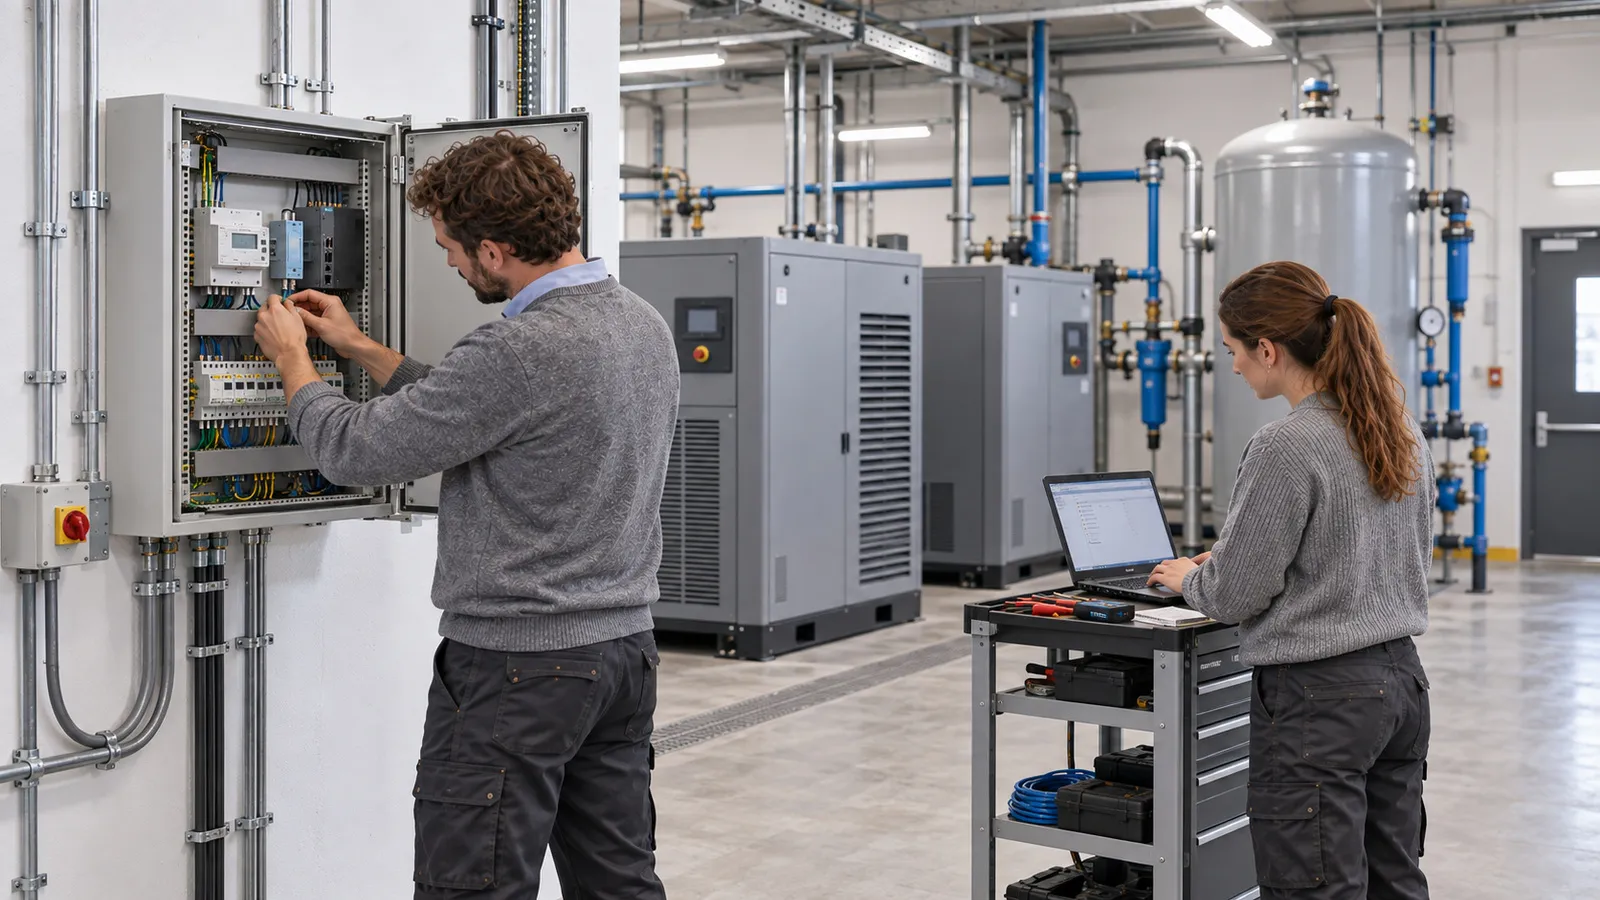
Create the metering concept
A metering point plan organises electrical consumers and production areas.
 Ai
Ai2
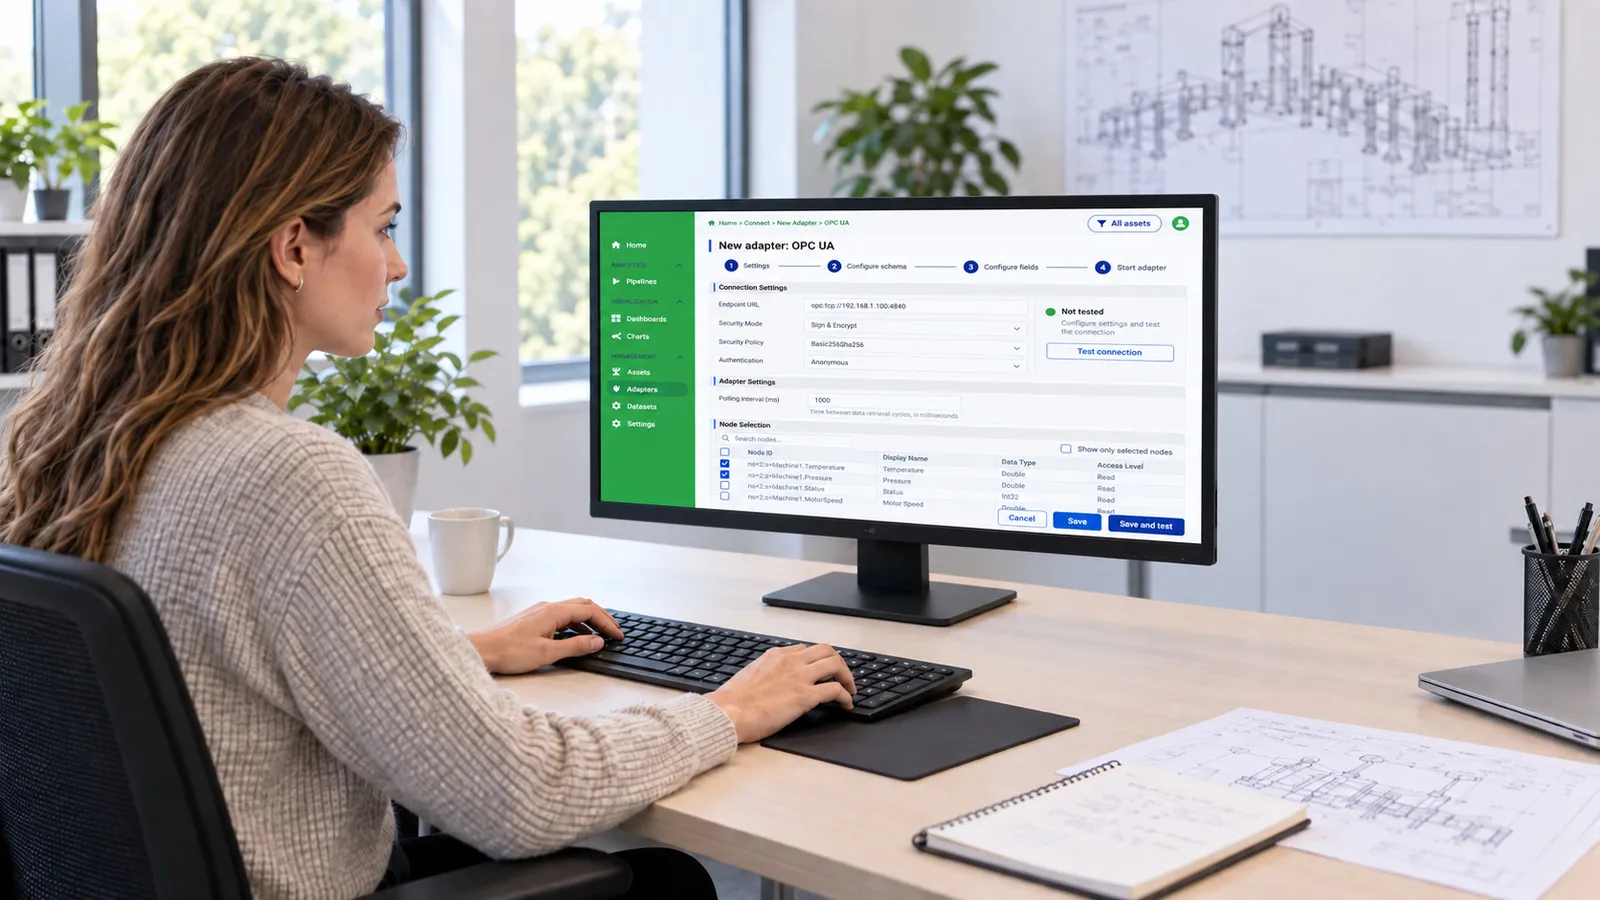
Connect the meters
Energy meters are connected to the edge PC, for example via RS-485 and suitable converters.
 Ai
Ai3
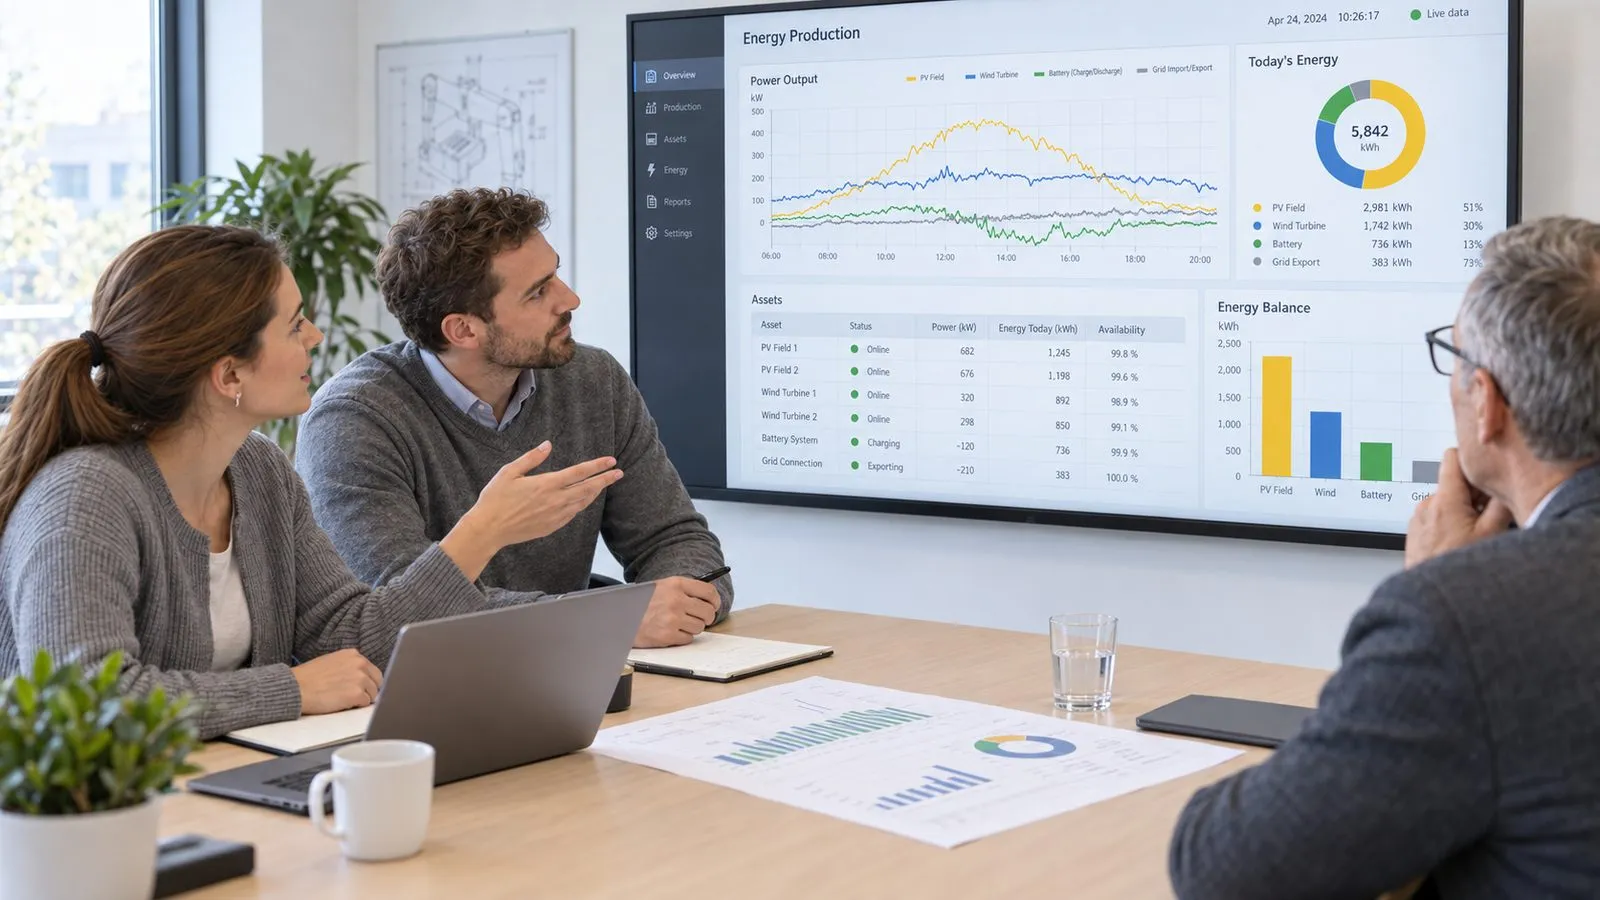
Configure Aurora
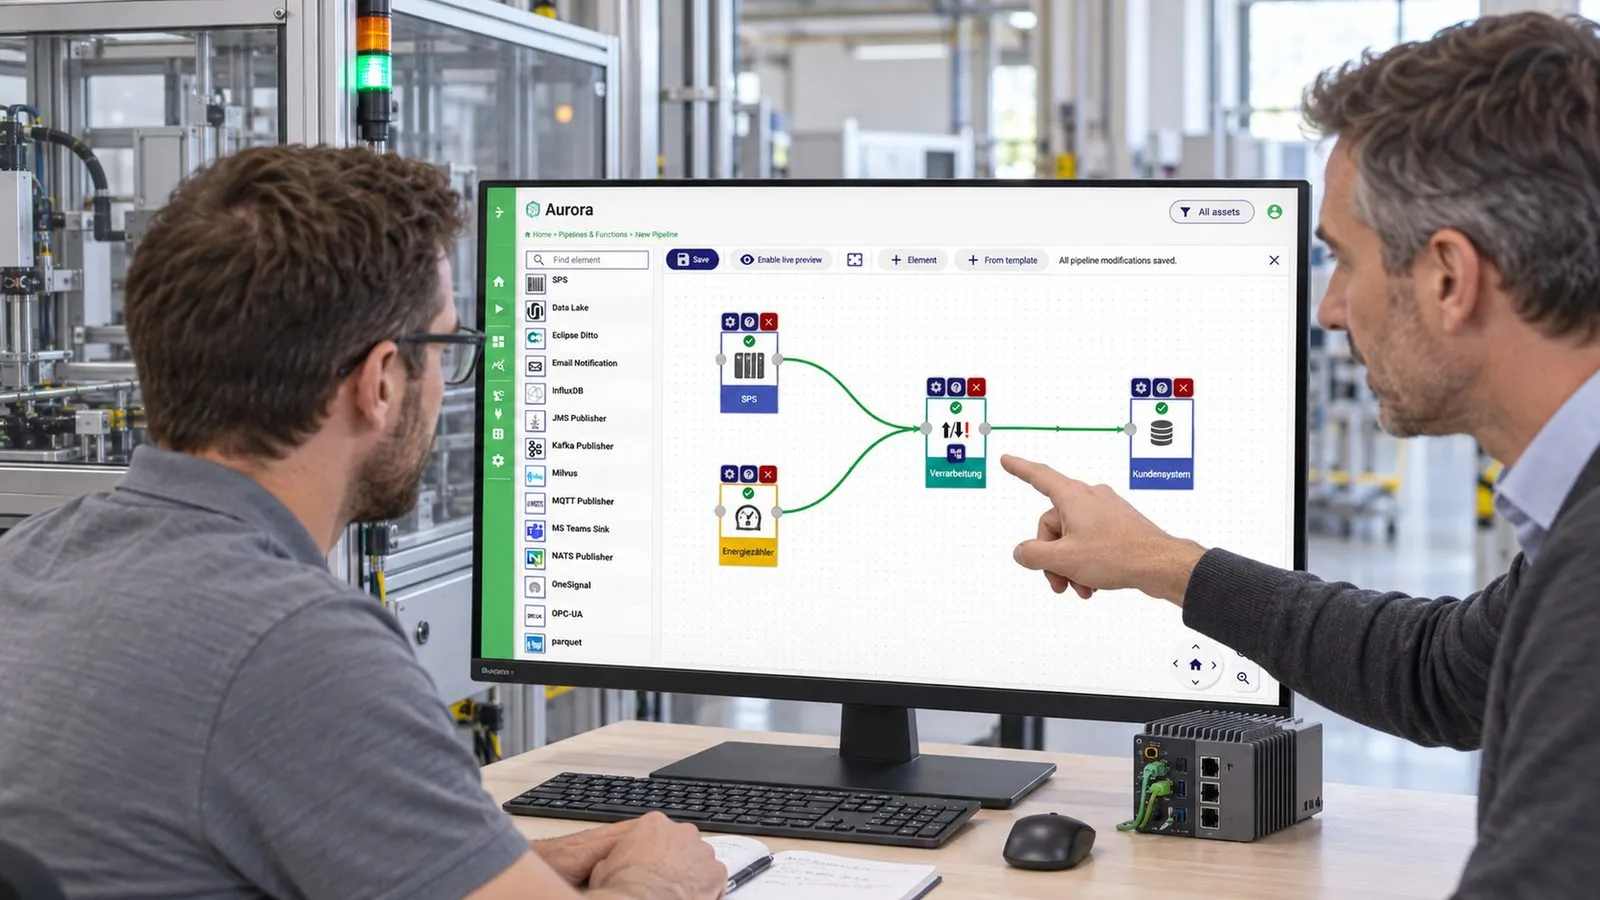
Adapters and data flow are set up in Aurora without programming.
 Ai
Ai4
Check incoming energy data
Current values, timestamps and trends arrive in the dashboard and are checked.
Transformer stations and main and secondary consumers are recorded via measuring points.
The energy for compressed air generation and other media is included in the analysis.
The photovoltaic system and the combined heat and power plant can be included in the balance.
Energy and media meters are connected via common industrial interfaces.
Which meters and protocols fit is clarified during the survey.






Project experience
Looking at energy and production together at a backing brick works.
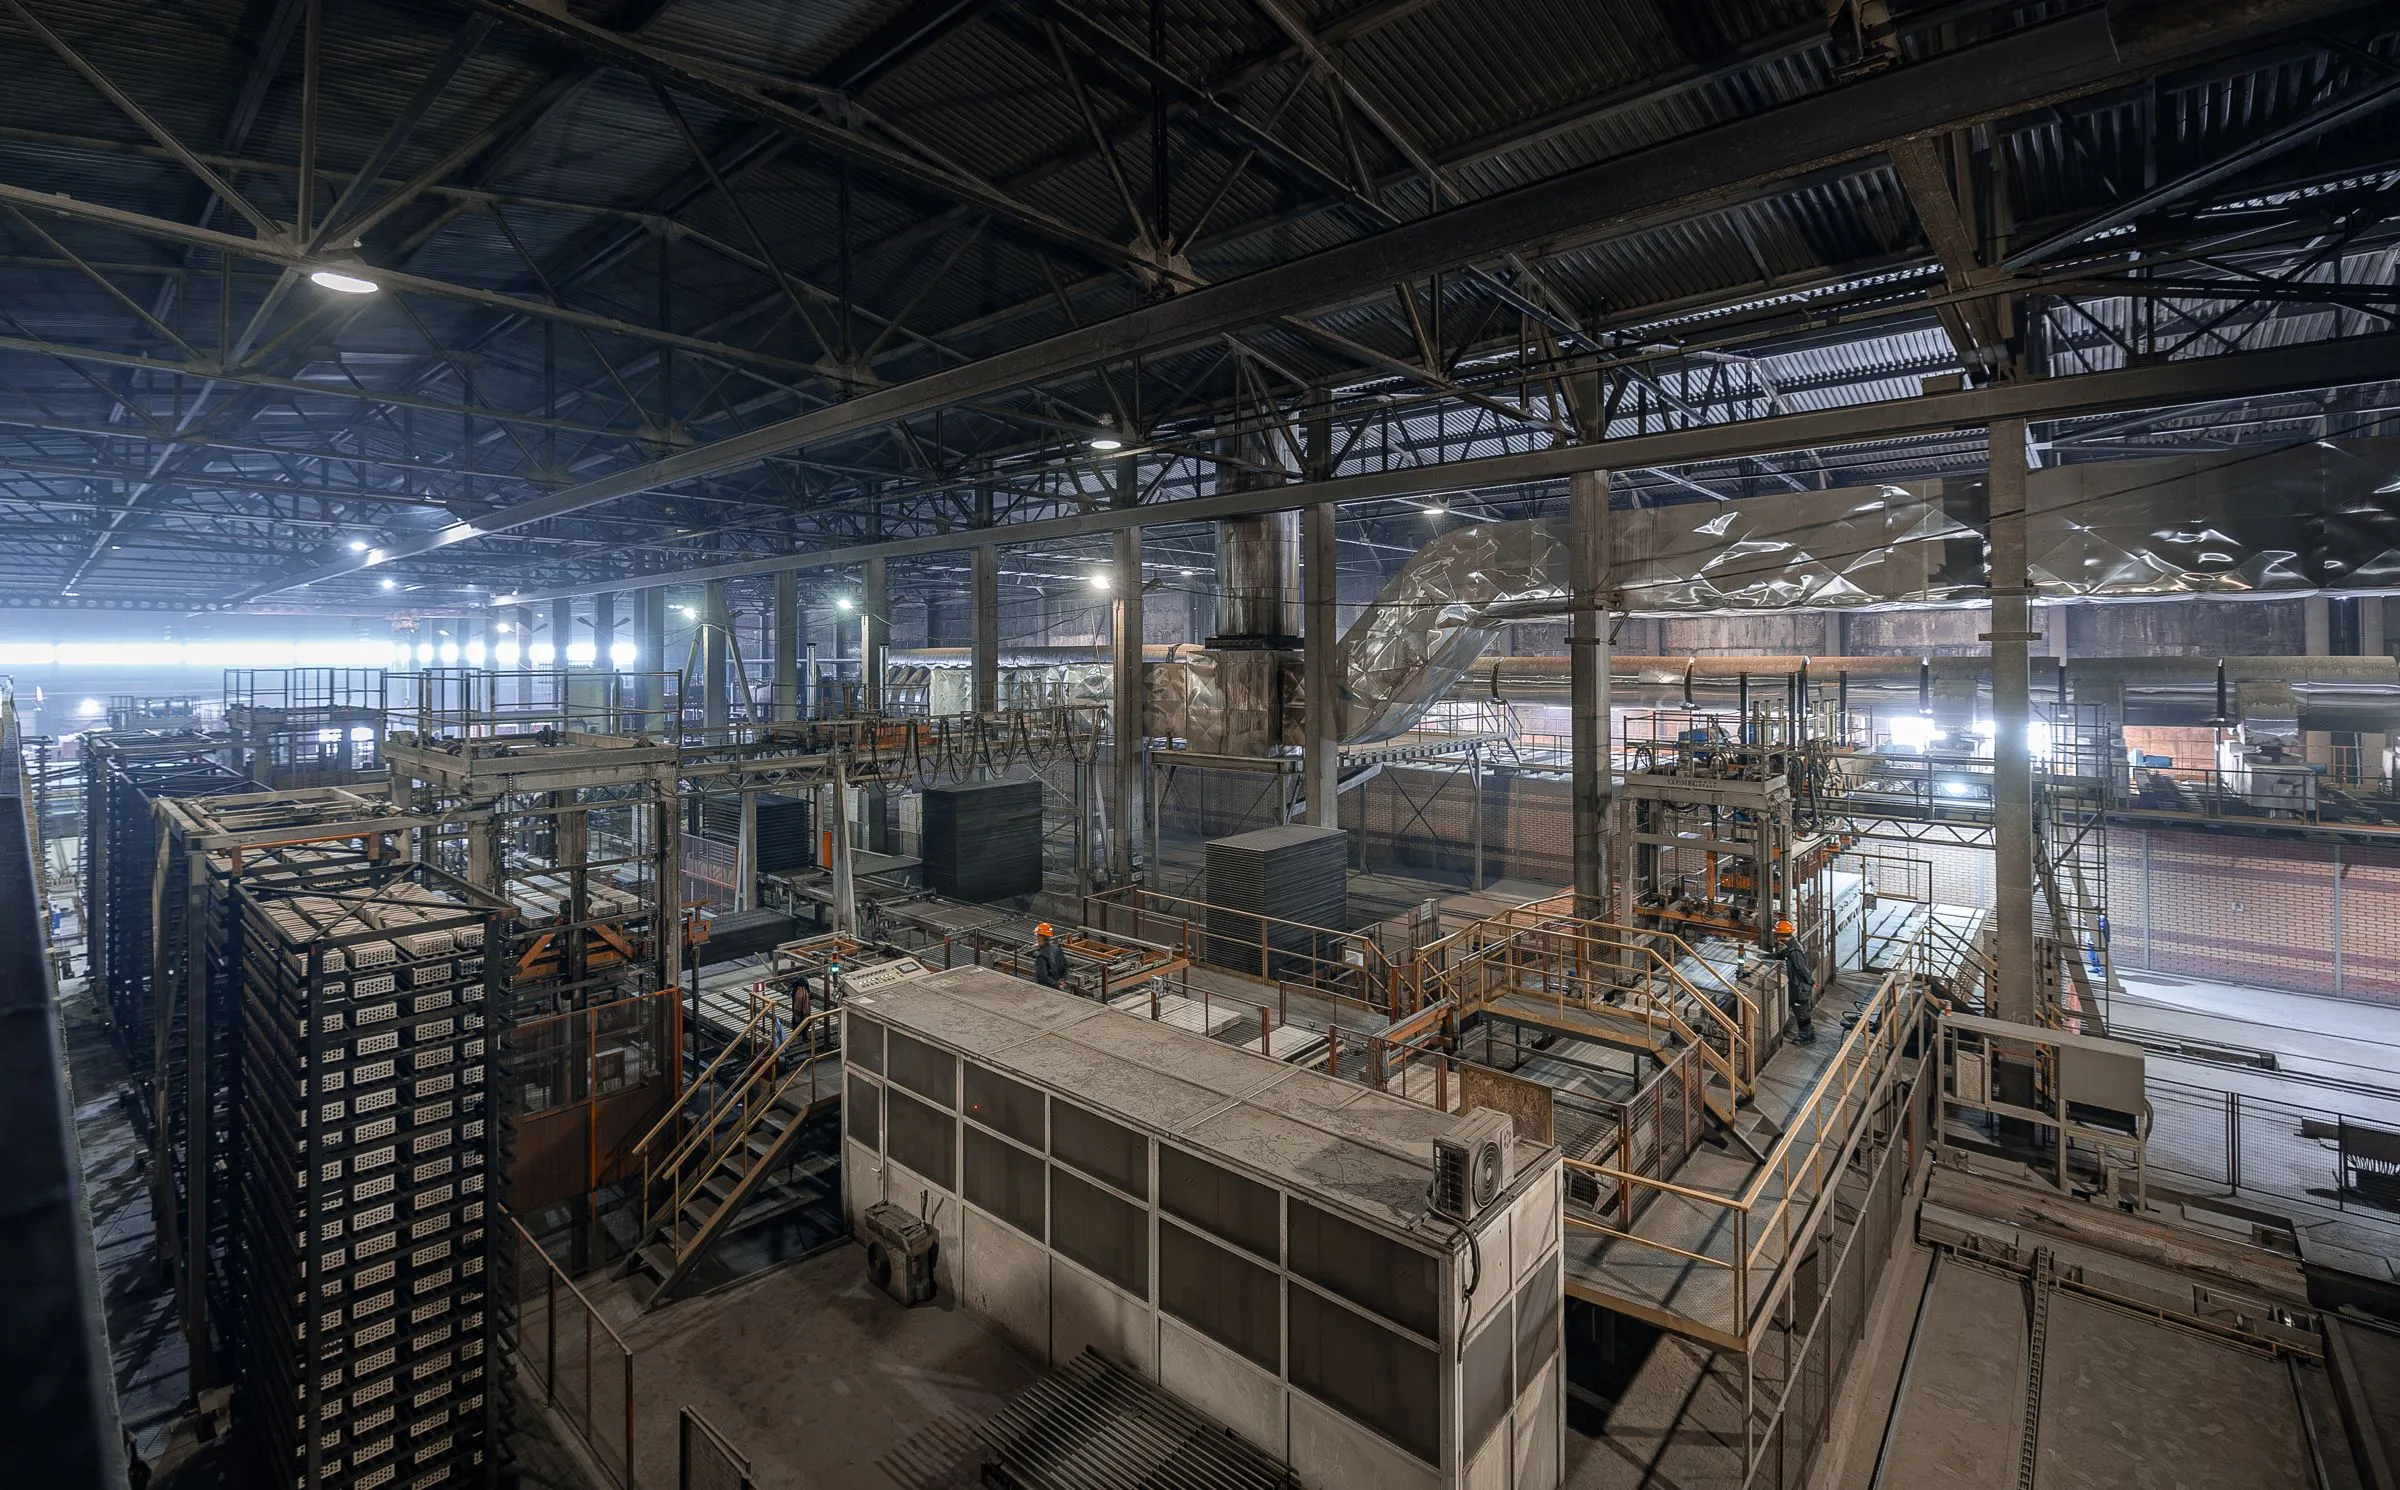
IQstruct Engineering has delivered energy data monitoring for a backing brick works. The solution brings together values from transformer stations, the photovoltaic system and the combined heat and power plant with production data. Consumption can therefore be viewed in relation to the batches produced. Meter trends are available individually, aggregated and historically. The example shows why a single meter reading does not yet provide a reliable statement about the energy demand of a production step.
We are glad to answer your detailed questions in a personal conversation.
The batch-related assignment shows the energy use of a produced quantity. It does not involve a measurement per individual item.
We only quantify savings on the basis of reliable measured values from your plant.
By site, line, machine, process, product or order, depending on the metering concept and the available data.
Every industry has its particularities. That calls for a reliable partner who knows the requirements and delivers suitable solutions.
First conversation
Describe your task. We agree a date and discuss the possible project scope.
 Ai
Ai1
You request an appointment
 Ai
Ai2
We discuss your requirements
 Ai
Ai3
You receive a quotation for the agreed scope

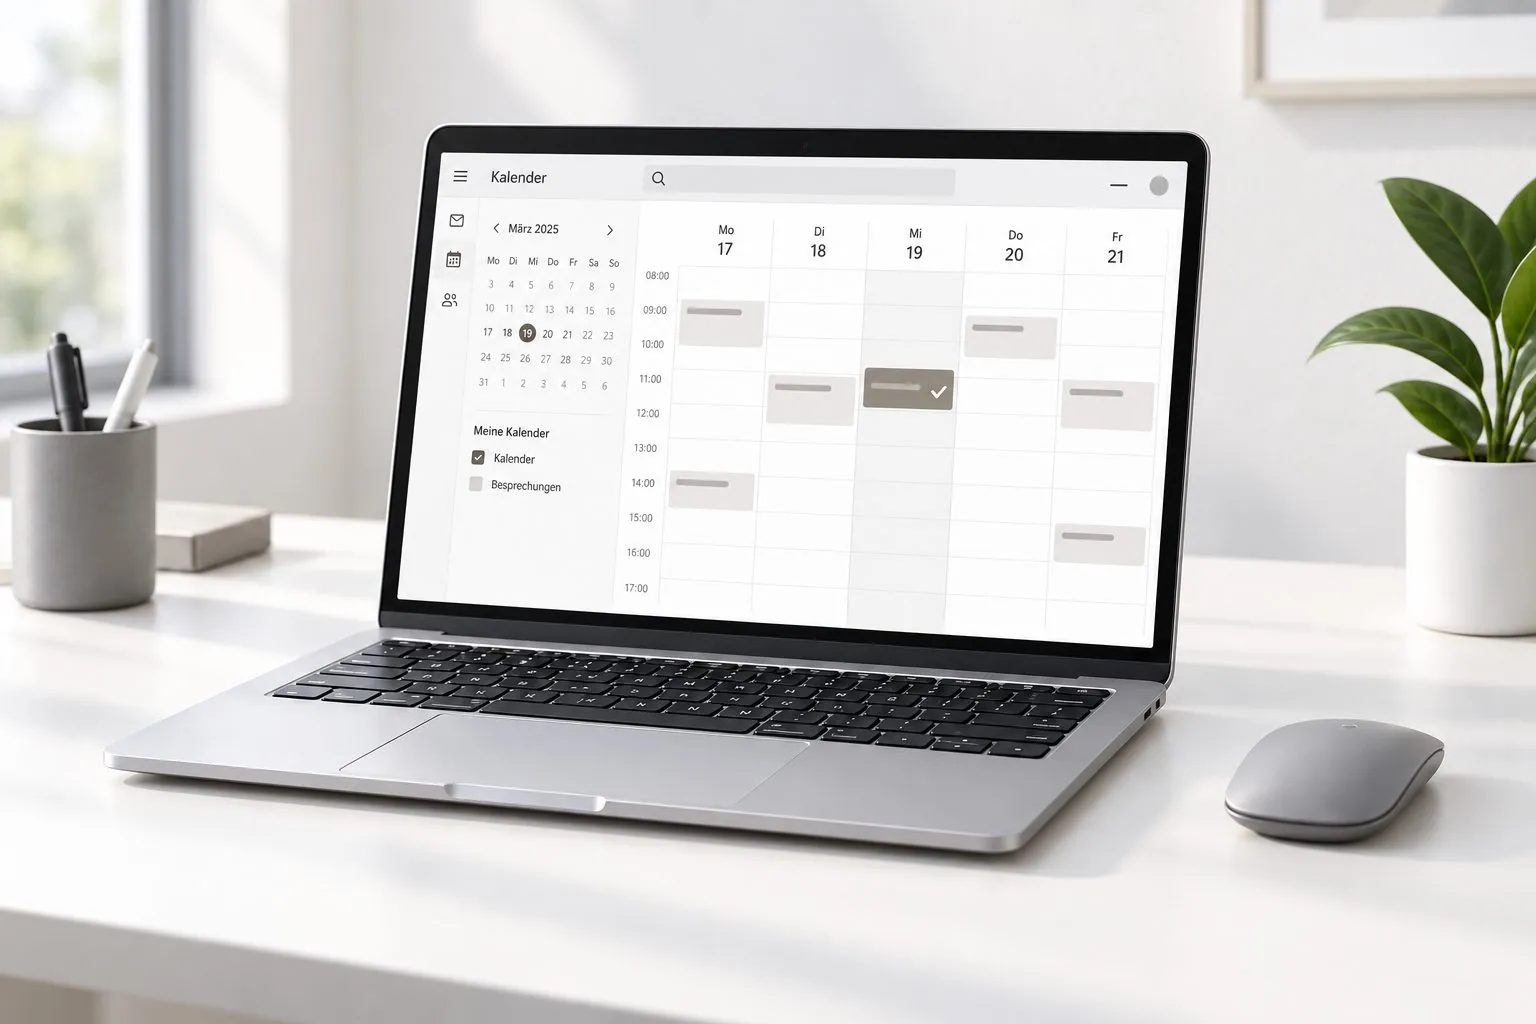
Describe your task in the contact form. We come back with a proposed date.
Arrange a first conversationBooking calendar
The booking calendar appears here. It loads only after your consent, because your browser connects to Microsoft in the process.
Discover further suitable services.
Acquire production and energy data from PLCs, meters and existing devices.
Make trends, relationships and deviations in production data visible.
Use pattern recognition and forecasts to examine production and energy data in a targeted way.