


Recognise conspicuous patterns
Measurement and process data are examined for the agreed question.
Suggestions appear from three characters.
No match. Try another term or choose a topic below.
Validate the controller against a model
The topic area at a glance
Customers we work for
Joint projects and their results
Working at IQstruct Engineering
ISO 9001 and TISAX
Alliances, associations, marketplaces
Quality policy and certificate
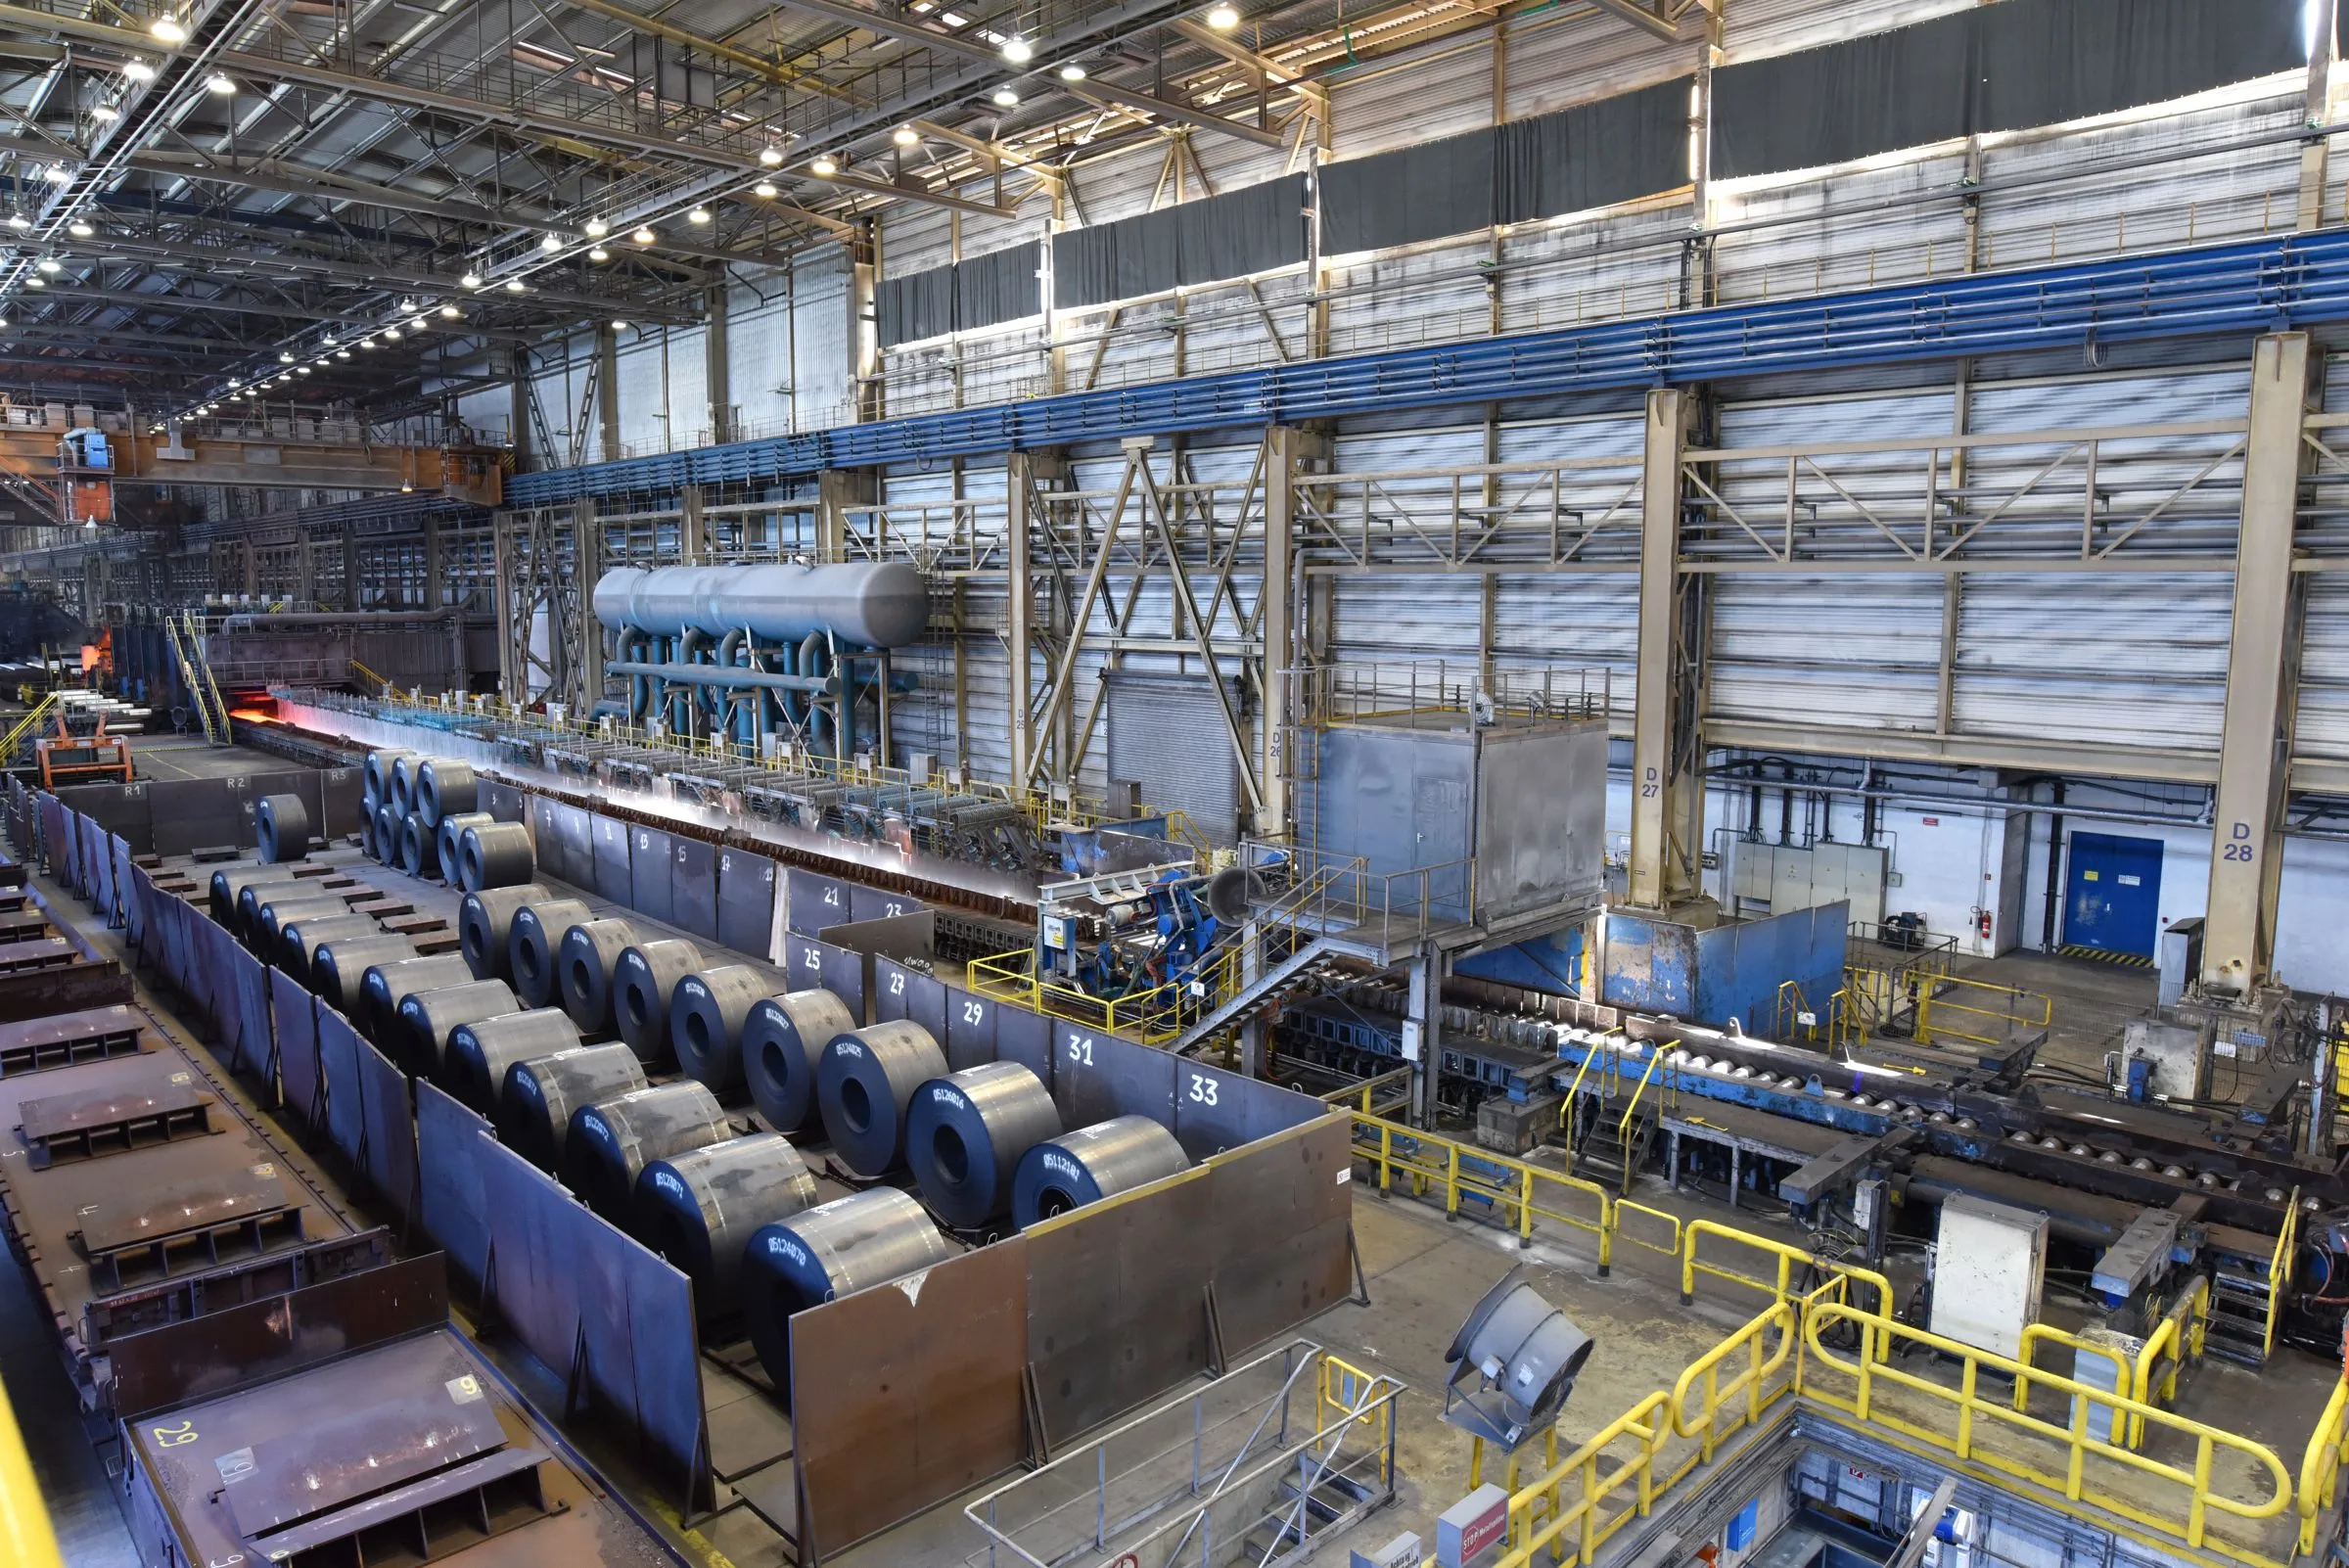
AI can examine patterns in production data and documents and provide indications for technical decisions.
A great deal of data is available, but its significance differs. Missing values, changed operating conditions or unsuitable comparison periods can distort a seemingly good result. Before a forecast, the question, the data quality and the assessment therefore have to be settled. Specialist users need traceable results and visible limits so that an analysis supports the decision instead of producing one more key figure.
IQstruct Engineering integrates specialised models for pattern and anomaly detection as well as for forecasts. Industrial data can be provided through Aurora. Local models and customer-specific applications connect the analysis with existing processes; results are assessed by specialists.
In a free first conversation we clarify which question the analysis is to answer and which data exists for it, in what quality.
Measurement and process data are examined for the agreed question.
History, current states and, where relevant, weather or price forecasts complete the data base.
Analyses are integrated into applications and prepared for human decisions.
IQstruct Engineering integrates specialised models for pattern and anomaly detection as well as forecasts.
Aurora provides the industrial data; local models and customer-specific applications connect the analysis with existing processes. Historical data are combined with current states and influencing factors, depending on the question, for example for an expected development in consumption.
Derived quantities can serve as virtual sensors. Such results count as an estimate or model value and are assessed technically before use.
AI data analysis
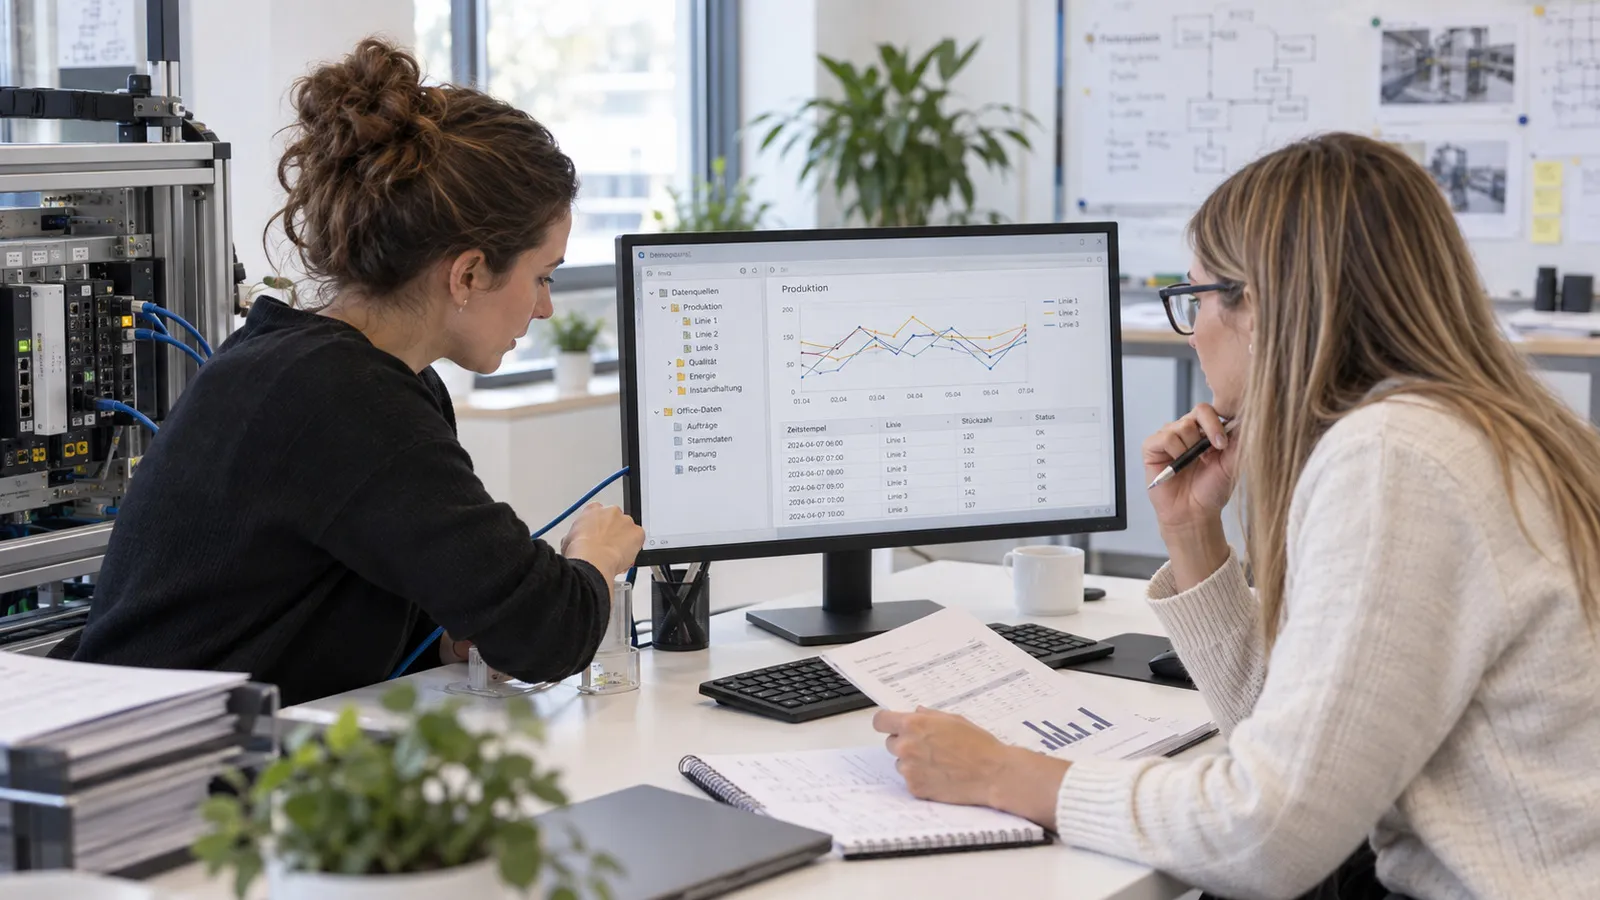
History, current states and influencing factors come together for the assessment.
 Ai
Ai1
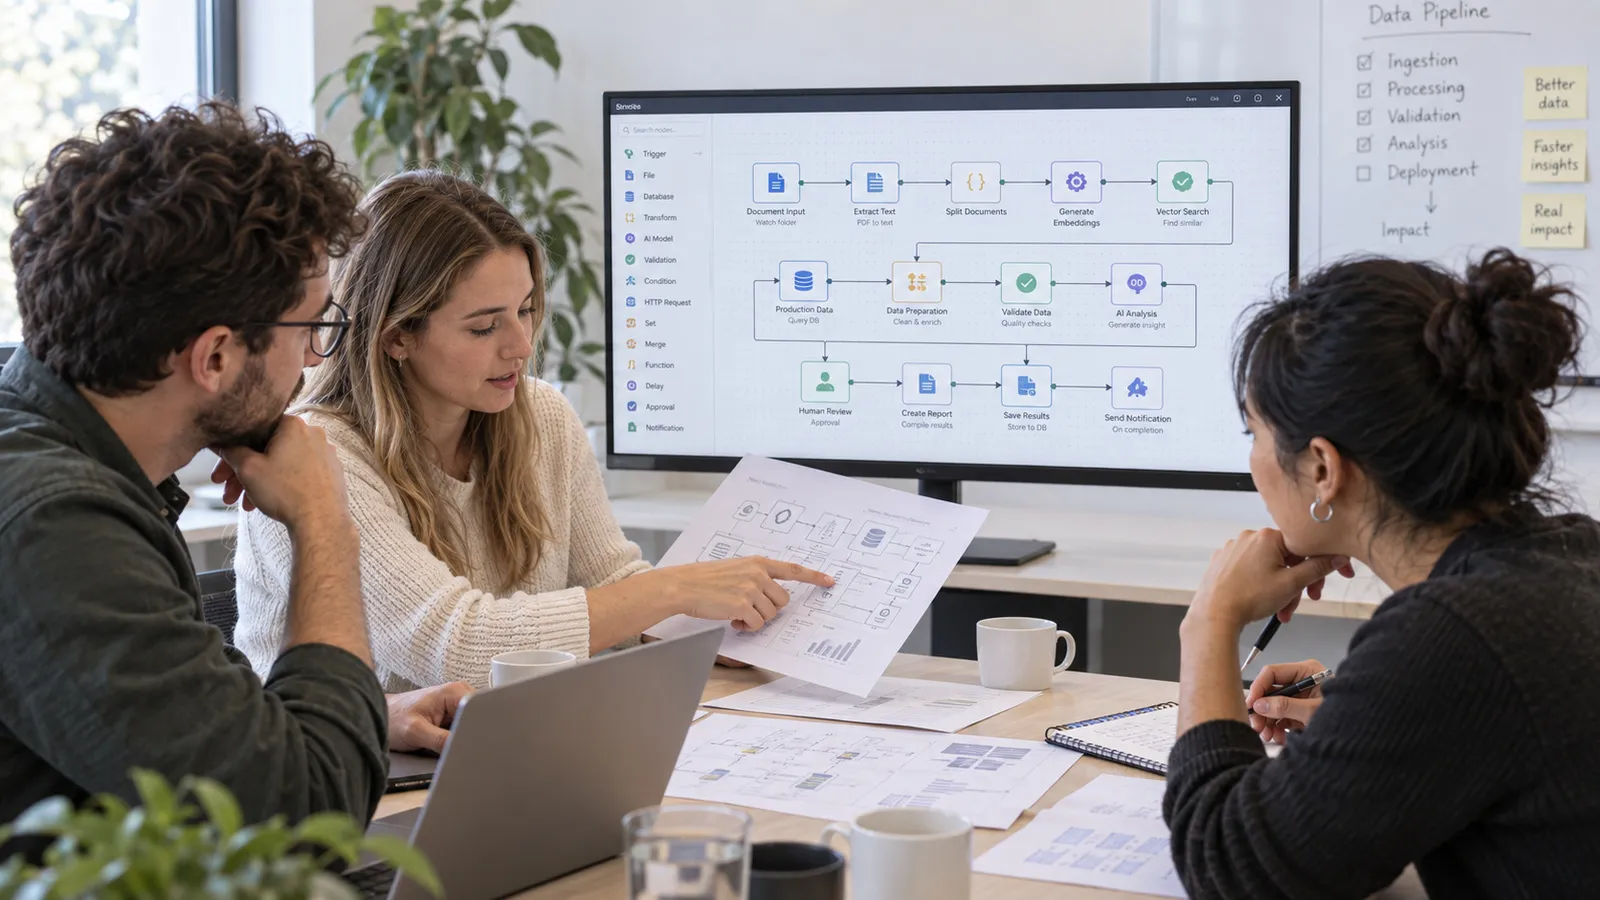
Record the data basis
Production data from Aurora and office information are assigned to the question.
 Ai
Ai2
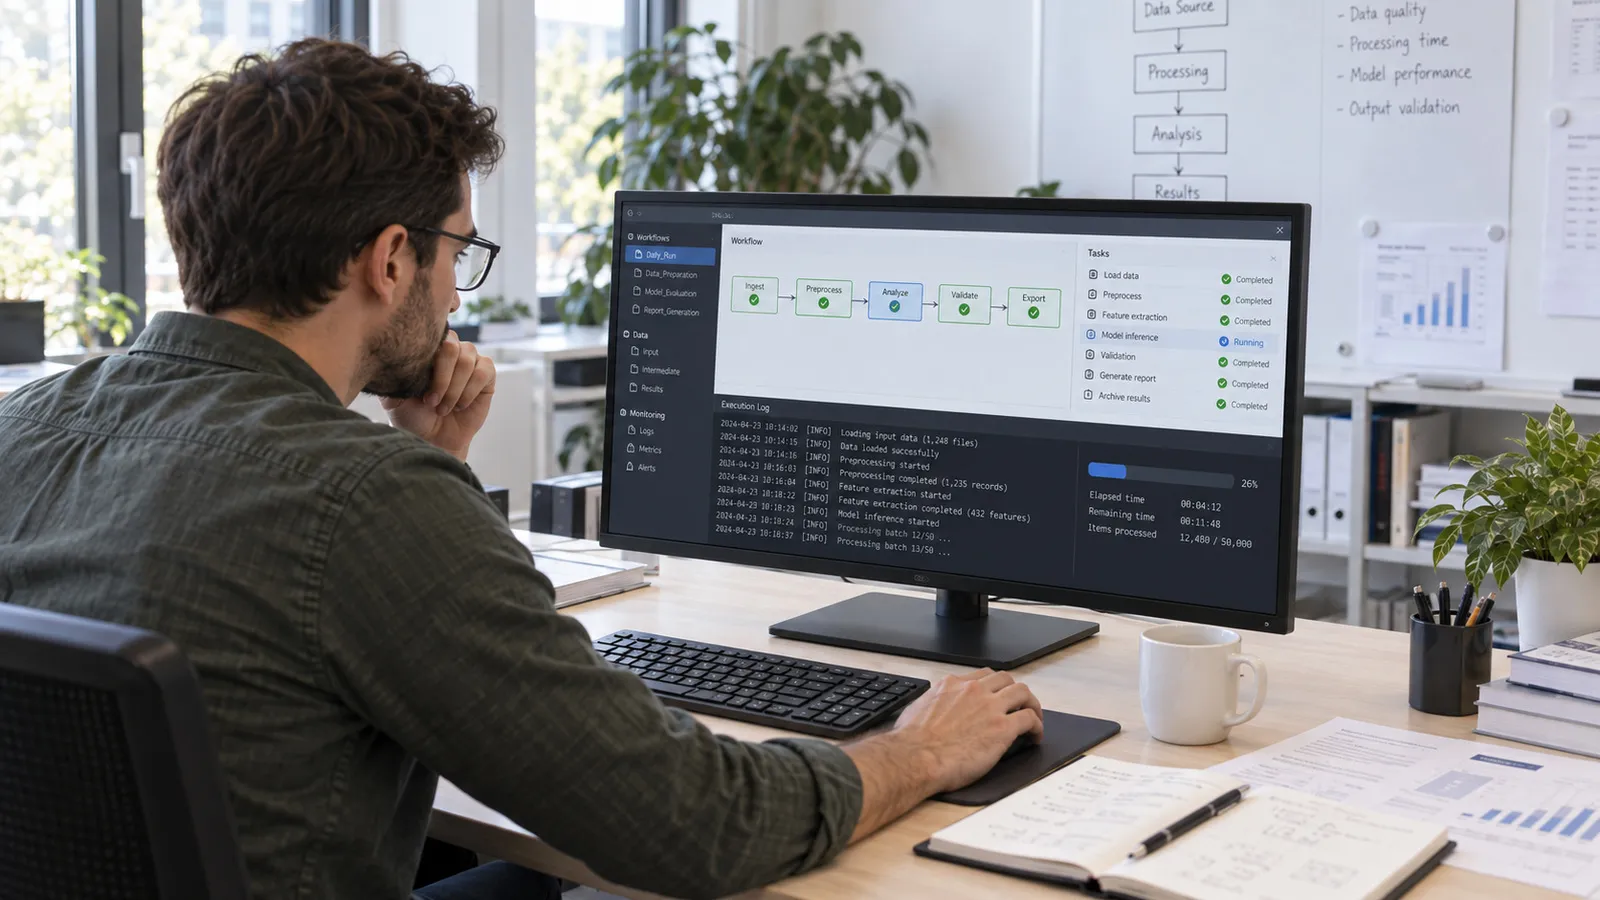
Model the analysis workflow
The data pipeline is built in a workflow environment such as n8n.
 Ai
Ai3
Run the analysis
The workflow's processing and resulting outputs are monitored.
 Ai
Ai4
Use results for decisions
Those responsible assess the analysis results and decide on measures.
Trends that deviate from the expected behaviour.
Expected developments, for example in energy consumption.
Derived quantities where no direct measurement is available.
Funding
Funding programmes may be available for consulting on and trialling your AI project.
IQstruct Engineering supports the survey, the project outline and the preparation of the application documents. Your company submits the application. Whether and to what extent funding is possible depends on the programme, the location and the project.
We are glad to answer your detailed questions in a personal conversation.
Forecasts are estimates. We check model quality and economic effect on your use case.
From industrial data acquisition via Aurora, supplemented by further sources such as weather or price forecasts.
A virtual sensor delivers a model value. It is compared with direct measurements and assessed technically.
Every industry has its particularities. That calls for a reliable partner who knows the requirements and delivers suitable solutions.
First conversation
Describe your task. We agree a date and discuss the possible project scope.
 Ai
Ai1
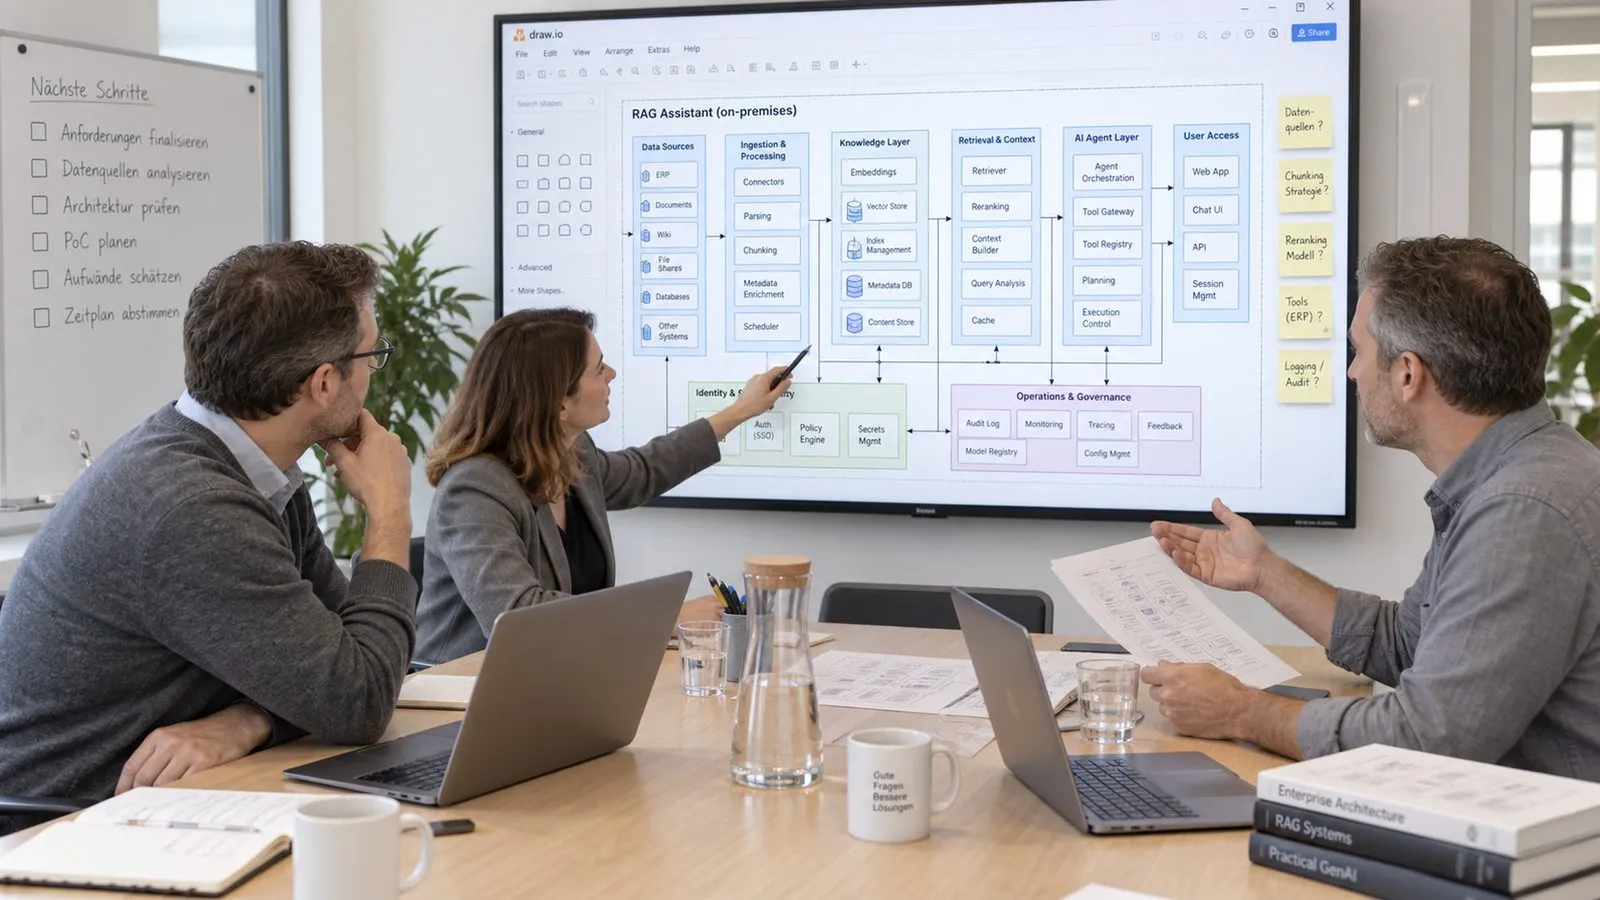
You request an appointment
 Ai
Ai2
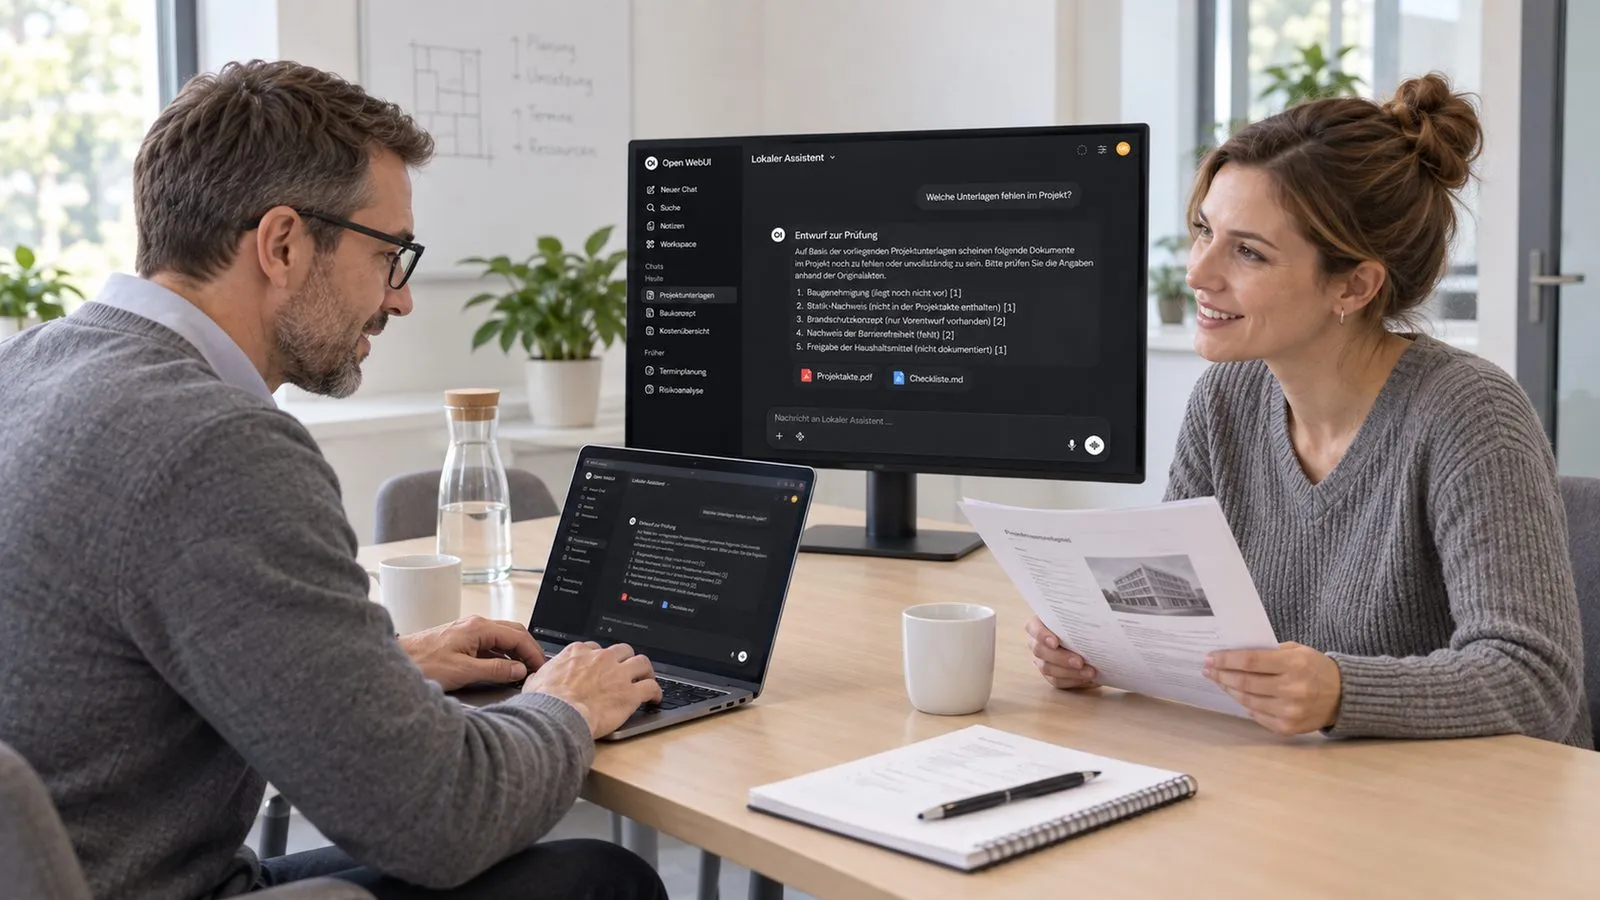
We discuss your requirements
 Ai
Ai3
You receive a quotation for the agreed scope

Describe your task in the contact form. We come back with a proposed date.
Arrange a first conversationBooking calendar
The booking calendar appears here. It loads only after your consent, because your browser connects to Microsoft in the process.
Discover further suitable services.
Make trends, relationships and deviations in production data visible.
Connect energy consumption with machines, operating times and production batches.
Plan models, hardware and support for AI in your own environment.
