Look at trends over time
Historical plant data show changes over the period under review.
Suggestions appear from three characters.
No match. Try another term or choose a topic below.
Validate the controller against a model
The topic area at a glance
Customers we work for
Joint projects and their results
Working at IQstruct Engineering
ISO 9001 and TISAX
Alliances, associations, marketplaces
Quality policy and certificate
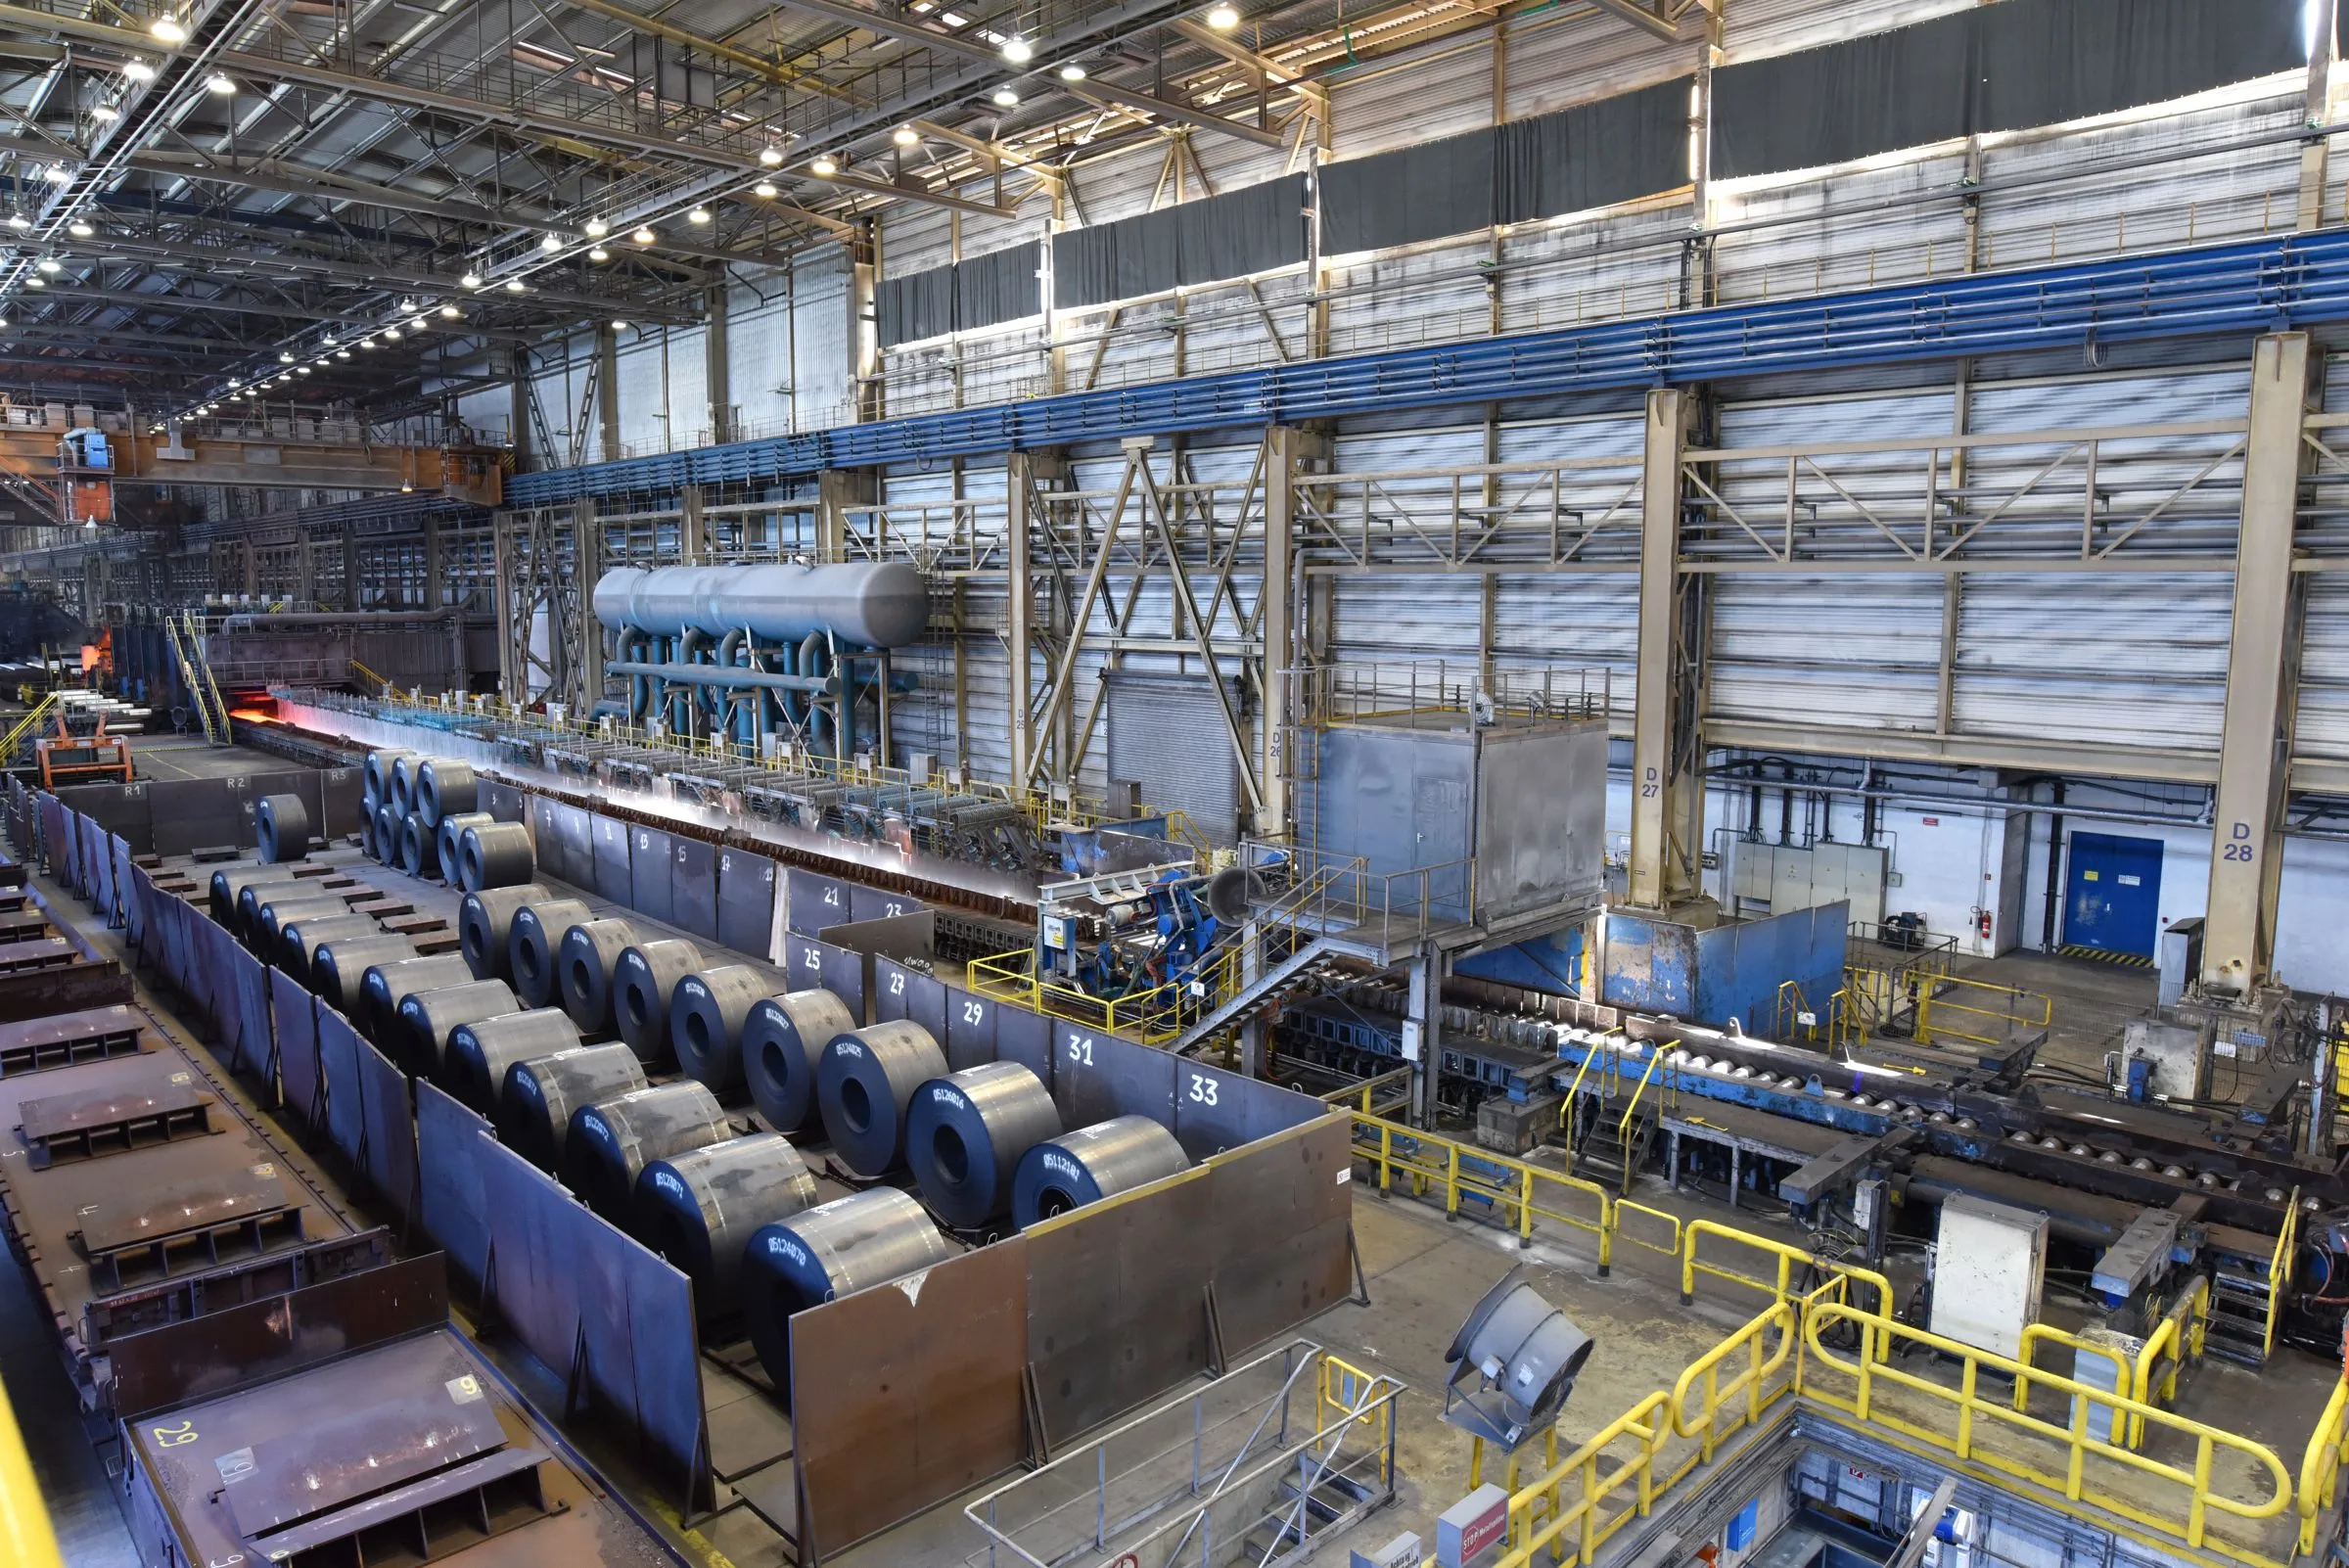
Consumption trends and machine states can only be compared with the right reference in time and plant.
The measured values are there, but shifts, batches or plants cannot be set against each other reliably. Missing values and differing time stamps make the analysis harder; a conspicuous trend does not yet explain its cause. A daily decision needs traceable views in which the origin of the data and the basis of comparison stay visible. The technical question therefore has to be taken into account as early as the preparation of the data.
In a free first conversation we clarify which question the analysis is to answer and which data the plants deliver for it.
Historical plant data show changes over the period under review.
Meter views can be used individually or aggregated.
Where needed, interfaces lead to customer-specific software or AI analysis.
IQstruct Engineering provides data for local visualisations in Aurora or for customer applications.
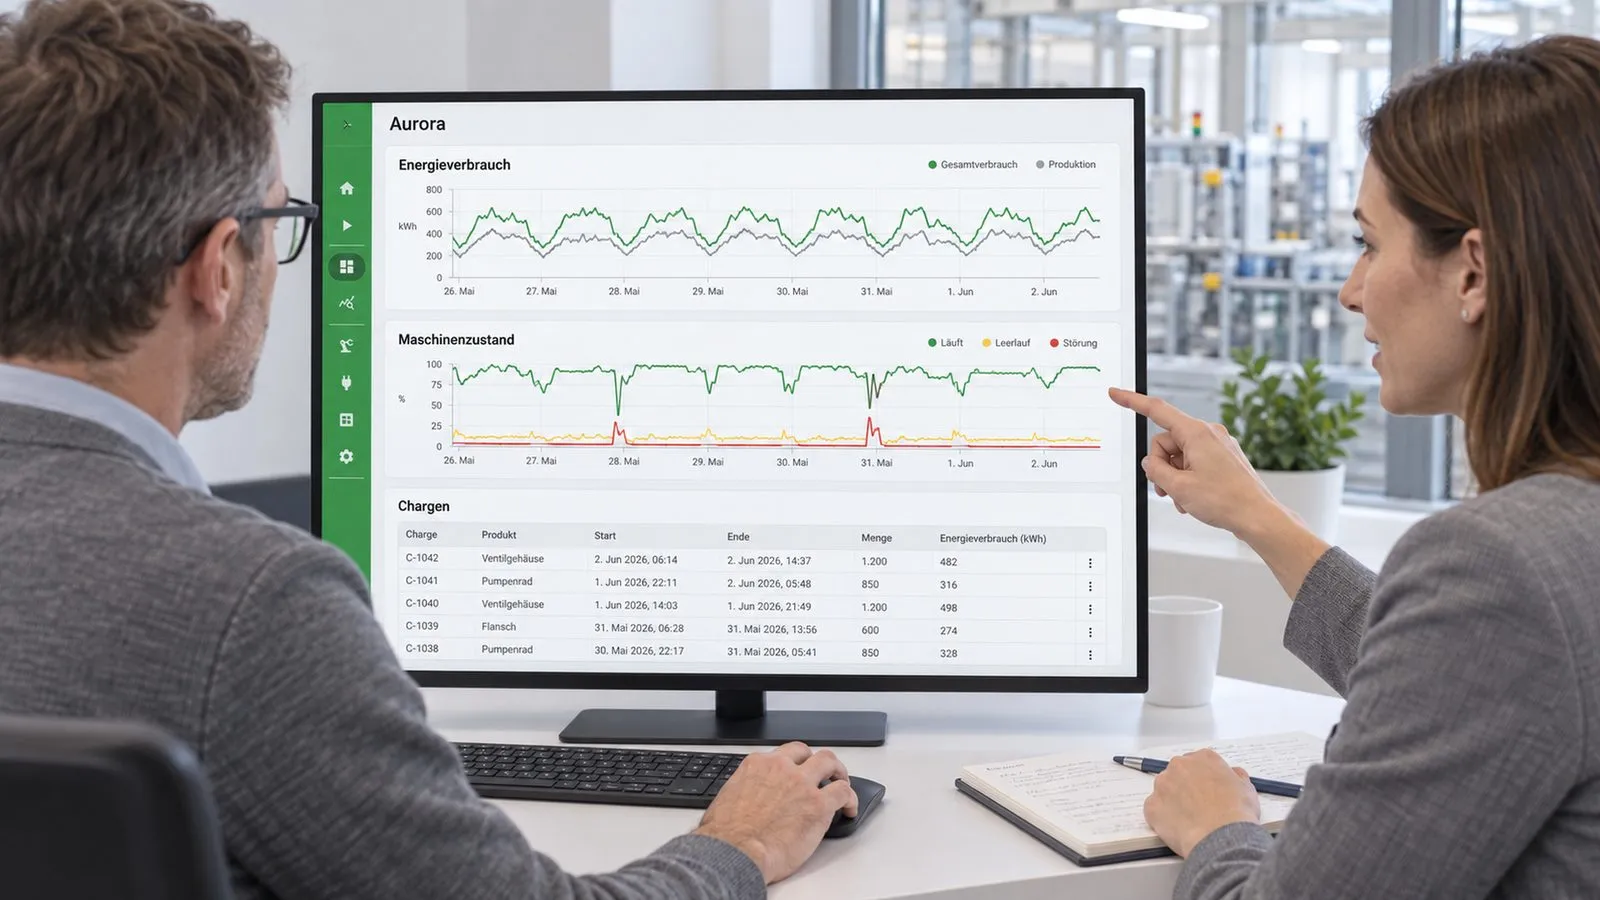
Trend graphs, individual views and aggregated meter data make historical developments comparable. Further forms of presentation are defined per project; where needed, a custom software solution extends the analysis.
At this works, continuous energy values are linked in time with production data. Consumption can thus be related to a produced batch quantity, and energy and production events can be viewed together.
Analytics
Historical data show how plants, meters and production develop over time.
 Ai
Ai1
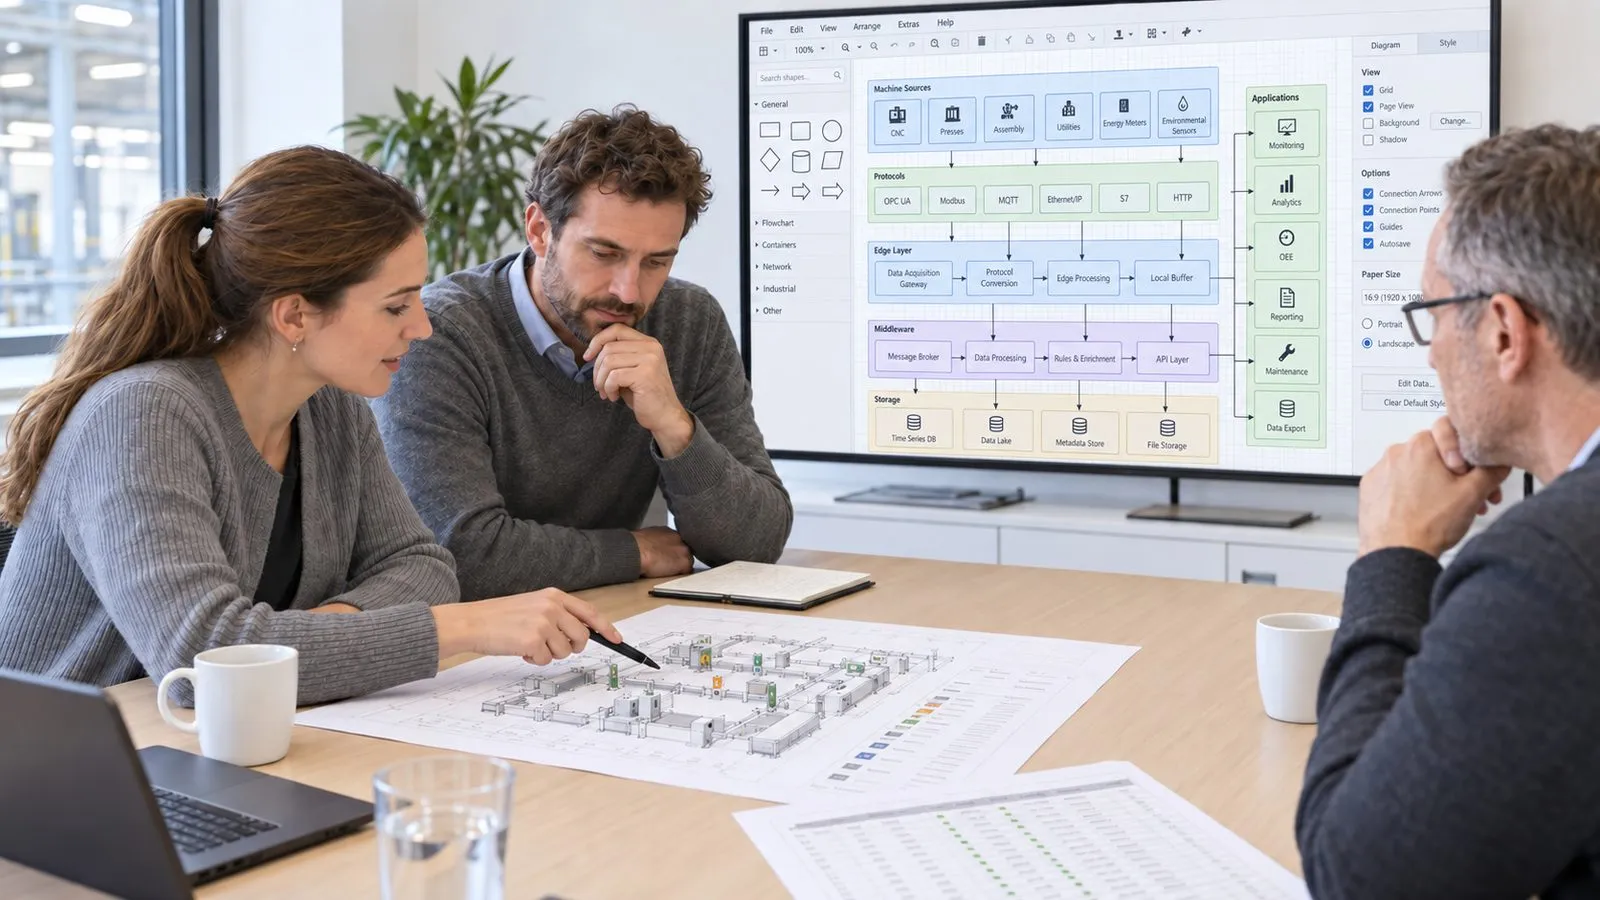
Record data requirements
Customer and specialists clarify which production data and information are needed.
 Ai
Ai2
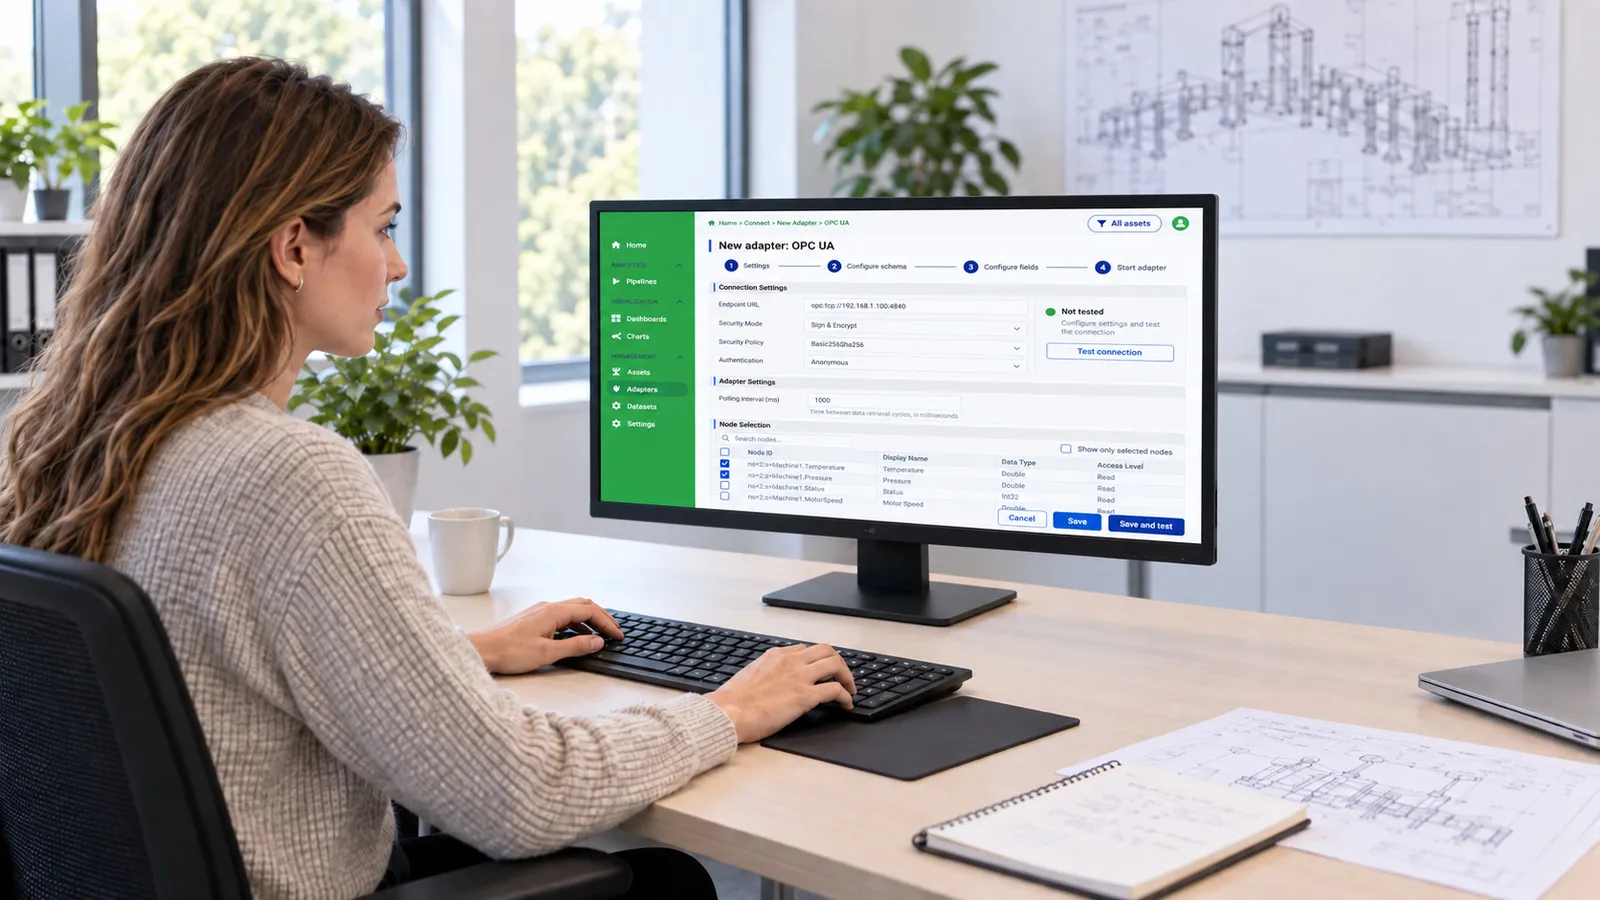
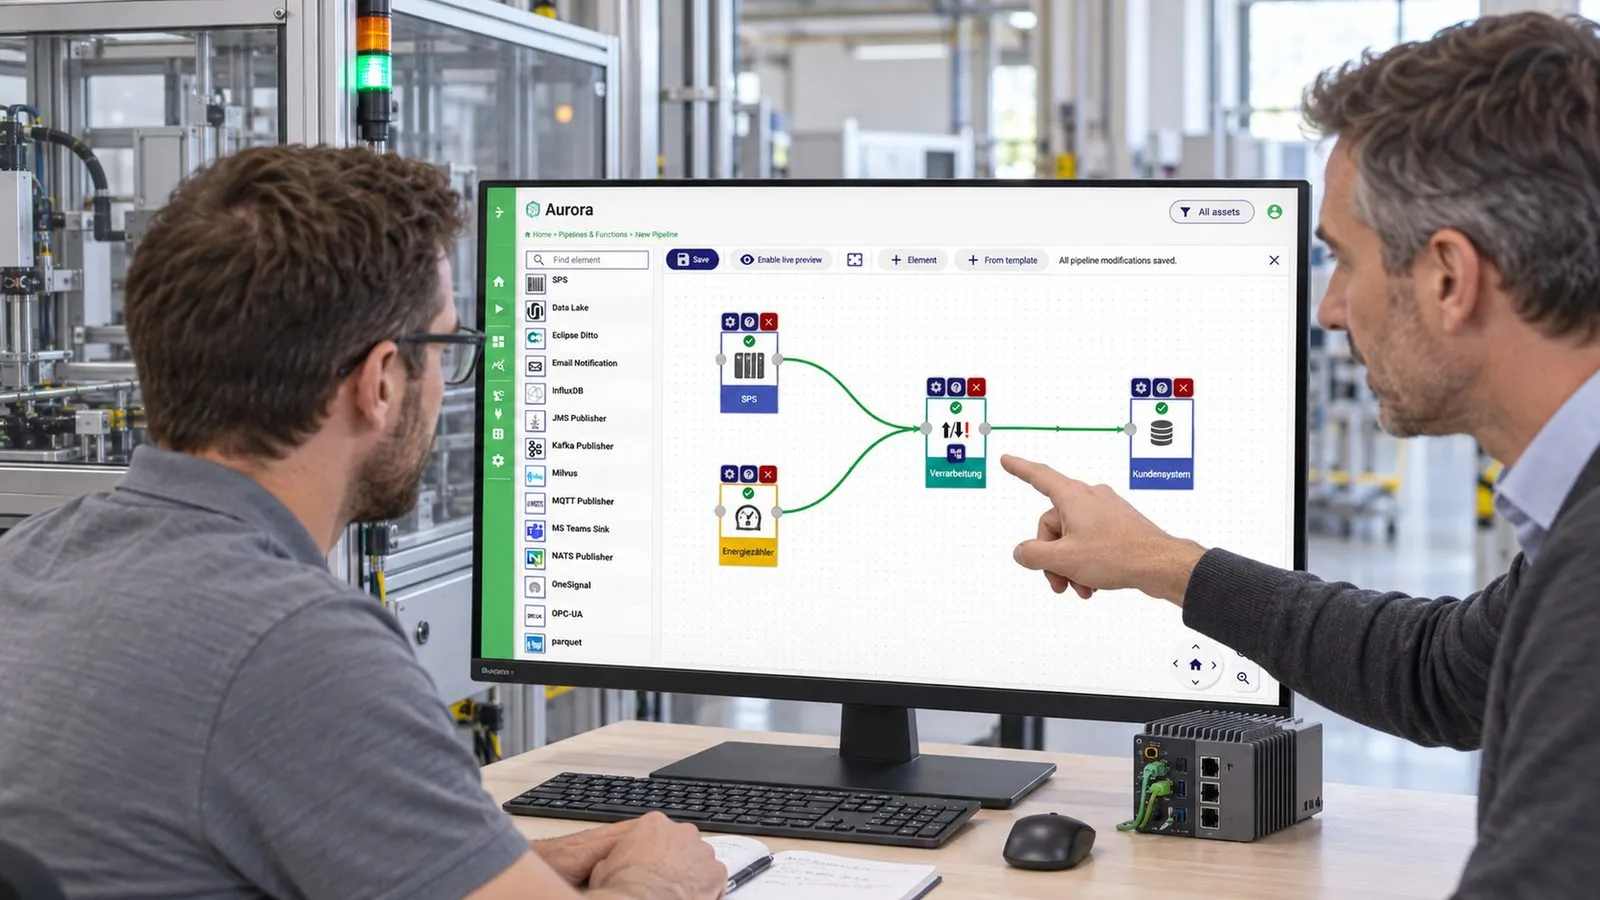
Configure Aurora
Adapters and data flow are set up in Aurora without programming.
 Ai
Ai3
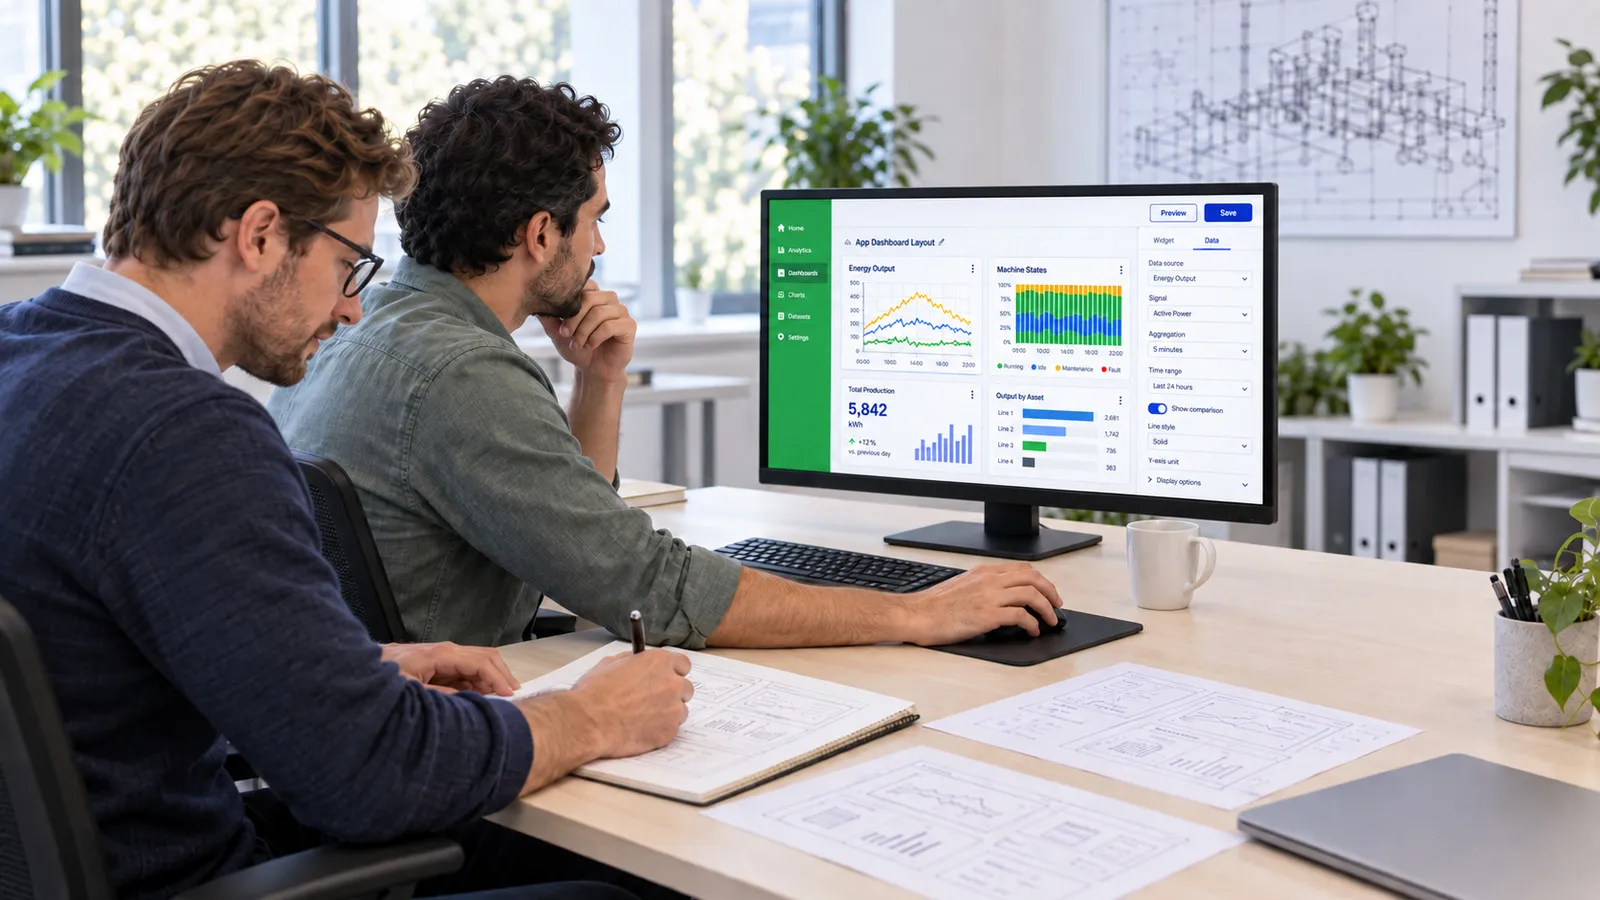
Design the dashboard
Views and measured variables are compiled for the production dashboard.
 Ai
Ai4
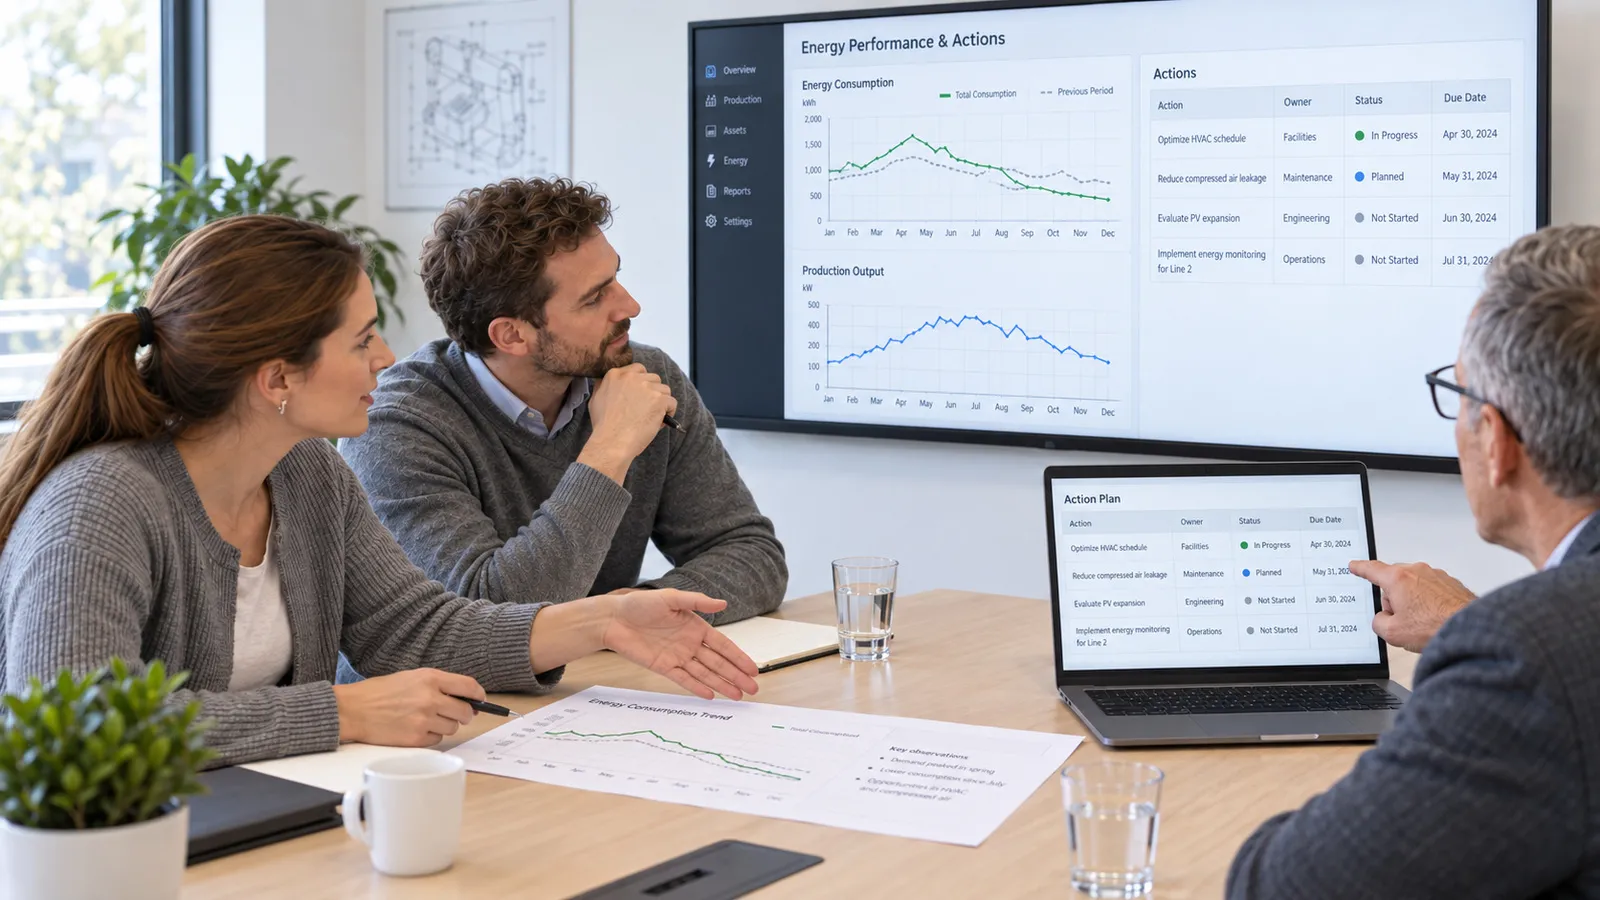
Discuss results and measures
Customer and specialists derive measures from energy and production trends.
Values of different meters over time.
Each meter on its own or several meters combined.
Periods and production batches in direct comparison.
The visualisation runs locally in Aurora or in your own applications.
The analysis runs on our own middleware Aurora, which keeps the values as time series and in SQL databases. For further analyses, interfaces provide the data.


Project experience
Looking at energy and production together at a backing brick works.
IQstruct Engineering has delivered energy data monitoring for a backing brick works. The solution brings together values from transformer stations, the photovoltaic system and the combined heat and power plant with production data. Consumption can therefore be viewed in relation to the batches produced. Meter trends are available individually, aggregated and historically. The example shows why a single meter reading does not yet provide a reliable statement about the energy demand of a production step.
We are glad to answer your detailed questions in a personal conversation.
A visualisation makes deviations visible. The cause is assessed in the context of the process; AI forecasts are an additional service.
The analysis relates consumption to a produced batch quantity. It does not involve a directly measured value per individual item.
Historical data allow comparisons across periods. We define filters by shift, state or variant in the project.
Every industry has its particularities. That calls for a reliable partner who knows the requirements and delivers suitable solutions.
First conversation
Describe your task. We agree a date and discuss the possible project scope.
 Ai
Ai1
You request an appointment
 Ai
Ai2
We discuss your requirements
 Ai
Ai3
You receive a quotation for the agreed scope

Describe your task in the contact form. We come back with a proposed date.
Arrange a first conversationBooking calendar
The booking calendar appears here. It loads only after your consent, because your browser connects to Microsoft in the process.
Discover further suitable services.
Connect energy consumption with machines, operating times and production batches.
Use pattern recognition and forecasts to examine production and energy data in a targeted way.
Combine dashboards, administration and business functions in one usable browser application.
Acquire production and energy data from PLCs, meters and existing devices.